
- Title
-
Olfactory Stimulation Selectively Modulates the OFF Pathway in the Retina of Zebrafish
- Authors
- Esposti, F., Johnston, J., Rosa, J.M., Leung, K.M., and Lagnado, L.
- Source
- Full text @ Neuron
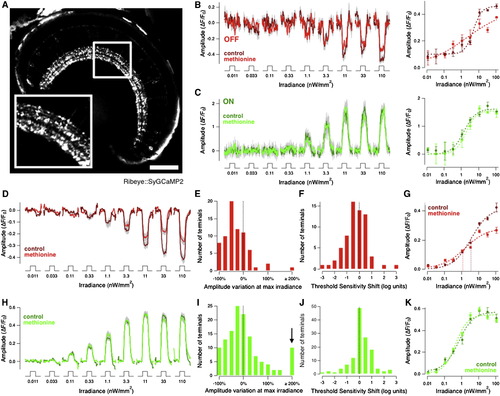
Olfactory Stimulation Selectively Reduces the Gain and Increases the Sensitivity of Luminance Responses through the OFF Visual Pathway (A) Retina of a ribeye::SyGCaMP2 fish showing synaptic terminals of bipolar cells in the IPL. Scale bar represents 100 μm. Inset shows 2× expansion. (B) Responses of an individual OFF bipolar cell terminal to 3 s steps of light increasing in irradiance (i.e., light intensity) by 0.5 log unit steps. Control responses in dark red and responses in methionine in light red. Average of four repetitions; SEM indicated in gray. Corresponding plot of intensity versus response amplitude to the right. Dotted lines are fits of the Hill function (see Experimental Procedures), with h = 1.77 and I1/2 = 4.94 nW/mm2 in control and h = 0.39, I1/2 = 2.10 nW/mm2 in methionine. (C) Responses of an individual ON bipolar cell terminal to the same series of stimuli shown in (B). Control responses dark green and responses in methionine in light green. Corresponding plot of intensity versus response amplitude to the right. No significant difference on application of methionine (h = 1.24 and I1/2 = 1.40 nW/mm2 in control and h = 1.45, I1/2 = 1.83 nW/mm2 in methionine). (D) Averaged responses of 84 OFF bipolar cell terminals from seven fish (8–11 dpf) to stimulus protocol shown in (B). Average amplitude of response to bright light was reduced by 36.6% ± 8.2%. SEM is shown in gray. (E) Histogram showing the percentage changes in the SyGCaMP2 responses of OFF terminals from (D), after application of methionine (response to the brightest step of light, 110 nW/mm2). (F) Histogram showing the threshold sensitivity shifts in the SyGCaMP2 responses to light of OFF terminals from (D), after application of methionine. The median increase in sensitivity was 0.5 log units, significantly different from 0 (p = 0.02). (G) Intensity versus response amplitude plot averaged from the same population of OFF terminals shown in (D). Dotted lines are fits of the Hill function with h = 0.70 and I1/2 = 6.16 nW/mm2 in control and h = 0.66, I1/2 = 1.86 nW/mm2 in methionine. Note that methionine application increased sensitivity by lowering I1/2 by 0.52 log units, i.e., 2.75 times (p < 0.0001). (H) Averaged responses of 116 ON bipolar cell terminals from seven fish (8–11 dpf) to stimulus protocol shown in (B). Across this complete population, methionine did not cause any significant change in luminance response. (I) Histogram showing the percentage changes in the SyGCaMP2 responses of ON terminals from (H), after application of methionine (response to the brightest step of light, 110 nW/mm2). Average increase was 5% ± 7% (average ± SEM). Note the small population of terminals (<9%) in which methionine caused an increase in the SyGCaMP2 response to bright light (arrow; 3-fold or more). See also Figures S1A and S1B. (J) Histogram showing the sensitivity shifts in the SyGCaMP2 responses to light of ON terminals from (H), after application of methionine. The median shift in sensitivity was 0. (K) Intensity versus response amplitude plot averaged from the same population of ON terminals shown in (H). Dotted lines are fits of the Hill function with h = 0.93 and I1/2 = 0.84 nW/mm2 in control and h = 1.14, I1/2 = 0.60 nW/mm2 in methionine. All responses were recorded between 9:00 and 11:00 a.m. For early afternoon experiments, please see Figures S1C–S1F. See also Figure S1. |
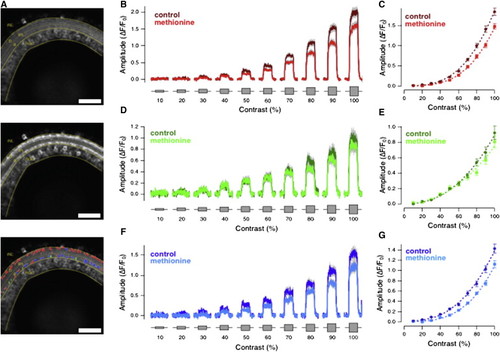
Olfactory Stimulation Reduces Synaptic Responses to Variations in Temporal Contrast in OFF and ON-OFF Retinal Ganglion Cell Dendrites (A) Example of a eno2::GCaMP3.5 fish retina, recorded in vivo, at rest (top), and during contrast stimulation (middle). The panel on the bottom shows the responding regions of the IPL color-coded according to their polarity (OFF, red; ON, green; ON-OFF, blue; see also Figure S3). Please note the calcium reporter expression in the IPL and in the RGC layer, plus some rare displaced retinal ganglion cells localized in the inner nuclear layer (INL). Note also the preferential distribution of OFF responses in the sublamina b of the IPL and of ON and ON-OFF responses in the sublamina a of the IPL (bottom). Scale bar represents 200 μm. (B) Average response of 186 OFF ROIs from RGC dendrites n = 5 eno2::GCaMP3.5 transgenic zebrafish to the same temporal contrast protocol in Figure 2, before (dark red) and after (light red) methionine administration. SEM is indicated in gray. Please note how methionine reduced the amplitude of OFF responses in a similar way to that observed for OFF bipolar cell terminals (Figure 2A). (C) Plot of contrast versus response amplitude averaged from the same population of OFF ROIs shown in (B). As for Figure 2, the response is measured as the steady deflection from the baseline. Dotted lines are fits of a power function, A = k × Cα, with α = 2.96 ± 0.11 in control and α = 3.27 ± 0.09 in methionine. (D and E) Average response to contrast and contrast versus response amplitude plot of 69 ON ROIs from RGC dendrites, to the same temporal contrast protocol in Figure 2, before (dark green) and after (light green) methionine administration. Dotted lines are fits of a power function, A = k × Cα, with α = 2.32 ± 0.12 in control and α = 2.11 ± 0.20 in methionine. (F and G) Average response to contrast and contrast versus response amplitude plot of 79 ON-OFF ROIs from RGC dendrites, to the same temporal contrast protocol in Figure 2, before (dark blue) and after (light blue) methionine administration. Dotted lines are fits of power functions, A = k × Cα, with α = 2.65 ± 0.25 in control and α = 3.18 ± 0.15 in methionine. Please note that methionine reduced the amplitude of ON-OFF responses in a similar way to that observed for OFF retinal ganglion cells (B and C) and OFF bipolar cell terminals (Figures 2A and 2B). See also Figure S3. |