
FIGURE
Fig. 5
- ID
- ZDB-FIG-130906-22
- Publication
- Armant et al., 2013 - Genome-wide, whole mount in situ analysis of transcriptional regulators in zebrafish embryos
- Other Figures
- All Figure Page
- Back to All Figure Page
Fig. 5
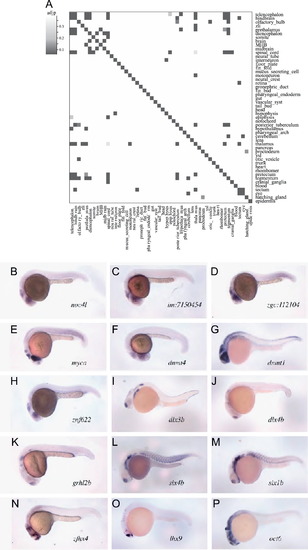
Correlation of co-expressed TRs. (A) Heat map of adjusted p-values from Pearson′s Chi-squared test showing significantly co-expressed TRs. Correlation of co-expression at 24 hpf is found mainly for neuronal regions (adjp: adjusted p-value). Example of in situ expression for TRs co-expressed in the retina and tectum (B–H), sensory placodes (I–M) or telencephalon, hypothalamus, thalamus and hindbrain (N–P). MHB: midbrain–hindbrain boundary. |
Expression Data
| Genes: | |
|---|---|
| Fish: | |
| Anatomical Terms: | |
| Stage: | Prim-5 |
Expression Detail
Antibody Labeling
Phenotype Data
Phenotype Detail
Acknowledgments
This image is the copyrighted work of the attributed author or publisher, and
ZFIN has permission only to display this image to its users.
Additional permissions should be obtained from the applicable author or publisher of the image.
Reprinted from Developmental Biology, 380(2), Armant, O., März, M., Schmidt, R., Ferg, M., Diotel, N., Ertzer, R., Bryne, J.C., Yang, L., Baader, I., Reischl, M., Legradi, J., Mikut, R., Stemple, D., Ijcken, W.V., van der Sloot, A., Lenhard, B., Strähle, U., and Rastegar, S., Genome-wide, whole mount in situ analysis of transcriptional regulators in zebrafish embryos, 351-62, Copyright (2013) with permission from Elsevier. Full text @ Dev. Biol.