
Fig. 2
- ID
- ZDB-FIG-130906-19
- Publication
- Armant et al., 2013 - Genome-wide, whole mount in situ analysis of transcriptional regulators in zebrafish embryos
- Other Figures
- All Figure Page
- Back to All Figure Page
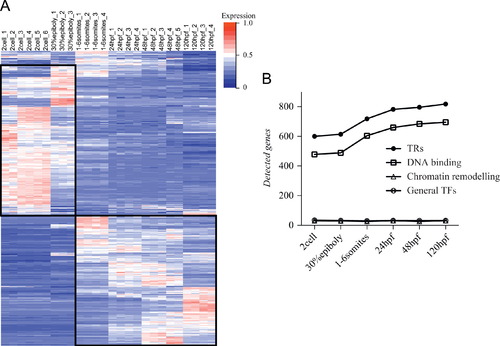
TR gene expression in developing zebrafish. (A) Temporal expression profile of 1219 TRs (rows) across six developmental stages (columns) by microarray analysis. Hierarchical clustering of normalised gene expression reveals two main clusters (black rectangles) discriminating genes either expressed prior (2 cells and 30% epiboly) or during organogenesis (1–6 somites to 120 hpf larvae). Blue: low expression; white: moderate expression; red: high expression. (B) Number of TR genes detected by microarray analysis. While the number of TF genes increases, the numbers of genes encoding chromatin remodelling and general transcription factors remain constant over the stages examined. |
Reprinted from Developmental Biology, 380(2), Armant, O., März, M., Schmidt, R., Ferg, M., Diotel, N., Ertzer, R., Bryne, J.C., Yang, L., Baader, I., Reischl, M., Legradi, J., Mikut, R., Stemple, D., Ijcken, W.V., van der Sloot, A., Lenhard, B., Strähle, U., and Rastegar, S., Genome-wide, whole mount in situ analysis of transcriptional regulators in zebrafish embryos, 351-62, Copyright (2013) with permission from Elsevier. Full text @ Dev. Biol.