
Fig. 4
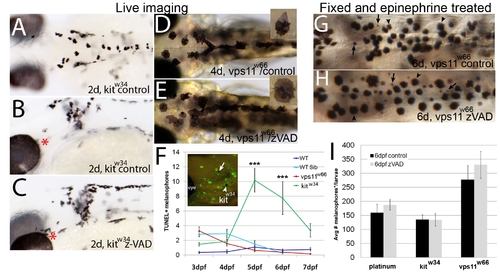
Melanophore loss in vps11w66 mutants is due to a caspase-independent mechanism. AC) Dorsal or lateral head images of 2dpf kitw34 control (A, B) or zVAD-fmk (C) treated larvae, beginning at 1dpf. Red asterisks indicate regions of changes in melanophore morphology and number suggesting rescue following zVAD-fmk treatment. Quantification and student t test indicate a significant increase in melanophore number (kitw34control, 109±9; kitw34zVAD, 147±9 melanophores; p<<0.05 by student t test). DE) Dorsal head and anterior trunk images (6X) of 4dpf (4d) control or zVAD-fmk treated vps11w66 larvae. Inset: 11X magnification of a single melanophore from the same larvae, showing melanosome hyperaggregation and partial hypopigmentation. F) Quantification of TUNEL positive melanophores in wildtype (AB, dark blue), vps11w66 wildtype sibling (cyan), vps11w66 mutant (red) and kitw34 mutant (green) zebrafish. We observe few to no TUNEL positive melanophores in vps11w66 mutants at all timepoints, but a significant number of TUNEL positive melanophores in kitw34 as expected. Two way ANOVA suggests a significant interaction between timepoint and genotype (p<0.0001). Multiple comparison analysis indicates significant differences in TUNEL+ cells between kitw34 and all other genotypes at 5 and 6dpf (p<0.0001***). Inset: Lateral head image of TUNEL positive cells in kitw34 mutant zebrafish (arrowhead, example of a TUNEL positive melanophore included in quantification; arrow, example of a TUNEL negative melanophore, not included in our quantification). Error bars are standard deviation. GH) Dorsal trunk images of fixed 6dpf vps11w66 larvae following control (G) or zVAD-fmk (H) treatment (26dpf; vps11w66 phenotype first observed at 2dpf) and epinephrine treatment to promote melanosome aggregation to ease quantification. Similar to Figure 1, both melanophores (indicated by arrowheads) and presumed melanophore fragments (indicated by arrows) were counted. I) Quantification of dorsal, lateral and ventral stripe melanophores (*and fragments with continous boundaries) in platinum, kitw34 or vps11w66 control or zVAD-fmk treated larvae. Two way ANOVA analysis indicates no significant interaction for genotype and zVAD treatment (Note: zVAD-fmk treatment beginning at 1dpf is required for kitw34 melanophore rescue). |
| Fish: | |
|---|---|
| Observed In: | |
| Stage Range: | Long-pec to Day 4 |