
Fig. 6
- ID
- ZDB-FIG-130807-8
- Publication
- Fang et al., 2013 - Characterization of transgenic zebrafish lines that express GFP in the retina, pineal gland, olfactory bulb, hatching gland, and optic tectum
- Other Figures
- All Figure Page
- Back to All Figure Page
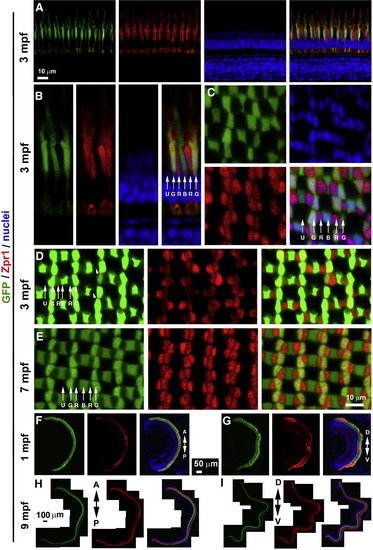
The Tg(LCRRH2-RH2-1:GFP)pt112 line expresses GFP strongly in green and blue cones and weakly in red cones in the retina. (A and B) At a low non-saturating laser excitation condition, similarly strong GFP expression levels were detected in the green and blue cones in 3-mpf retina. The panels in B are magnified local regions from the panels in A. (C) Transverse imaging of the photoreceptor layer shows the mosaic organization of the GFP-expressing green and blue cones at 3 mpf. (D) At a strong saturating laser excitation condition, weak GFP expression was detected in some but not all red cones (arrowheads) in the 3-mpf retina. (E) At 7 mpf, weak GFP expression was detectable in most red cones even under non-saturating laser excitation conditions. (F and I) GFP expression is present in the photoreceptor layer in the entire retina at 1 mpf and 9 mpf. The nuclei were labeled with TO-PRO nuclear dye or DAPI (blue, A–C). UV, green, red, and blue cones are indicated with lettered-arrows U, G, R, and B, respectively. |
Reprinted from Gene expression patterns : GEP, 13(5-6), Fang, W., Bonaffini, S., Zou, J., Wang, X., Zhang, C., Tsujimura, T., Kawamura, S., and Wei, X., Characterization of transgenic zebrafish lines that express GFP in the retina, pineal gland, olfactory bulb, hatching gland, and optic tectum, 150-9, Copyright (2013) with permission from Elsevier. Full text @ Gene Expr. Patterns