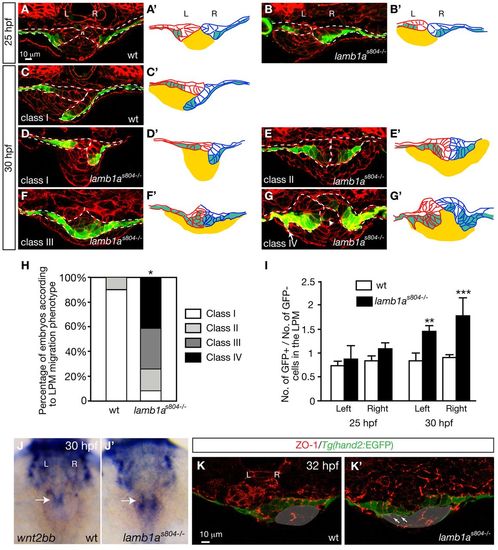
Loss of Lamb1a function affects LPM morphogenesis essential for asymmetric LPM migration and gut looping. (A,B) Expression of Tg(hand2:EGFP) in the LPM of wild-type (n=5) and lamb1as804 mutant (n=5) embryos at 25 hpf. GFP (green), phalloidin (red). (C-G) Four classes of LPM migration phenotypes were observed in wild-type (n=10) and lamb1as804 mutant (n=24) embryos at 30 hpf. In G, the arrow indicates the aberrant protrusion of a Tg(hand2:EGFP)-expressing cell into the gut. The arrowhead indicates a Tg(hand2:EGFP)-expressing cell located inside the gut. (A′-G′) The LPM and gut shown in A-G. Gut (yellow); left LPM (red); right LPM (blue); Tg(hand2:EGFP)-expressing cells (green). (H) Proportions of wild-type (n=10) and lamb1as804 mutant (n=24) embryos exhibiting the four classes of LPM migration phenotypes; *P<0.001. (I) Ratios (mean±s.e.m.) of Tg(hand2:EGFP)-expressing cells to Tg(hand2:EGFP)-non-expressing cells in the LPM at 25 and 30 hpf. Five wild-type and five mutants were examined at 25 hpf. Ten wild-type and 24 mutants were examined at 30 hpf. Asterisks indicate statistical significance: **P<0.05; ***P<0.01. (J,J2) Expression of the LPM marker wnt2bb in wild-type (J) and lamb1as804 mutant (J2) embryos at 30 hpf. Arrows indicate the expression in the LPM at the gut-looping region. Dorsal views, anterior towards the top. (K,K2) Expression of the tight junction protein ZO-1 (red) and Tg(hand2:EGFP) (green) in the LPM of wild-type (K) and lamb1as804 mutant (K2) embryos at 32 hpf. Arrows in K2 indicate LPM cells that protrude into the gut but still maintain localized ZO-1 expression. (A-G,K,K2) Transverse sections, dorsal towards the top. Scale bars: 10 μm. Broken lines outline the LPM. Shadows in K and K′ outline the gut primordium. L, left; R, right.
|
