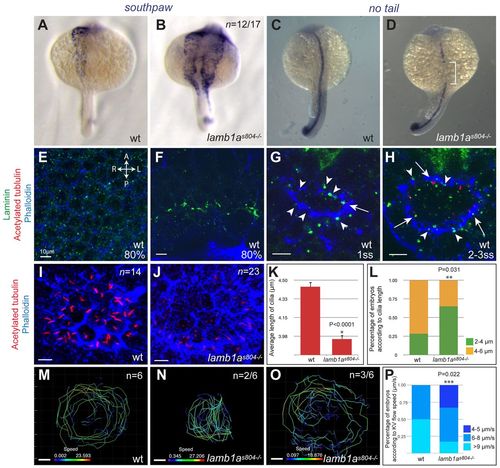
Lamb1a plays multiple roles in the establishment of left-right asymmetry. (A,B) Establishment of L-R gene expression machinery is examined by expression of southpaw/spaw in wild-type (A) and lamb1as804 mutant (B) embryos at 21 ss. (C,D) Integrity of the notochord is assessed by expression of no tail/ntl at 21 ss. Reduction of ntl expression in lamb1as804 mutants is restricted to the level of the visceral organ-forming region (white bracket). (A-D) Dorsal views. (E-H) Single-plane confocal imaging of wild-type embryos stained for Lam1 (green), acetylated tubulin (red) and phalloidin (blue). Dorsal views, anterior towards the top. Expression of Lam1 during KV morphogenesis in the epiblast (E) and at the margin (F) of 80% epiboly stage embryos. Discrete foci of Lam1 deposition are associated with the lumen of the vesicle (G, arrowheads) and where cilia formation takes place (H, arrows). Scale bars: 10 μm. (I,J) Confocal imaging projection of KV cilia at 8 ss, as revealed by acetylated tubulin staining (red) in wild-type (I) and lamb1as804 mutant (J) embryos. Counterstaining by phalloidin (blue). Scale bars: 10 μm. Dorsal views, anterior towards the top. (K,L) Quantitative analysis (mean±s.e.m.) of KV cilia length in wild type and lamb1as804 mutants. Asterisks indicate statistical significance, *P<0.0001 and **P=0.031. (M-O) Projection of bead trajectories depicts the fluid flow in the KV of wild-type (M) and lamb1as804 mutant (N,O) embryos at 10-12 ss. Lines depicting trajectories of beads within the KV and speed (μm/s) shown are for a representative embryo. (P) Quantitative analysis (mean±s.e.m.) of KV fluid flow in wild-type and lamb1as804 mutant embryos. Results depict average KV flow speed in six wild-type and six lamb1as804 mutant embryos. Asterisks indicates statistical significance, ***P=0.022.
|
