
FIGURE
Fig. 7
- ID
- ZDB-FIG-130802-54
- Publication
- Campbell et al., 2013 - Temporal and tissue specific gene expression patterns of the zebrafish kinesin-1 heavy chain family, kif5s, during development
- Other Figures
- All Figure Page
- Back to All Figure Page
Fig. 7
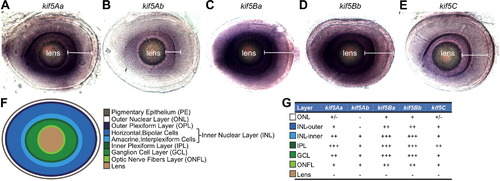
(A–E) Expression of kif5s in the retina at 96 hpf. White brackets show the expression domain of each individual kif5. (F) Diagram of zebrafish retinal organization. (G) Table summarizes the relative abundance of each individual kif5 across the retinal layers. |
Expression Data
| Genes: | |
|---|---|
| Fish: | |
| Anatomical Terms: | |
| Stage: | Day 4 |
Expression Detail
Antibody Labeling
Phenotype Data
Phenotype Detail
Acknowledgments
This image is the copyrighted work of the attributed author or publisher, and
ZFIN has permission only to display this image to its users.
Additional permissions should be obtained from the applicable author or publisher of the image.
Reprinted from Gene expression patterns : GEP, 13(7), Campbell, P.D., and Marlow, F.L., Temporal and tissue specific gene expression patterns of the zebrafish kinesin-1 heavy chain family, kif5s, during development, 271-279, Copyright (2013) with permission from Elsevier. Full text @ Gene Expr. Patterns