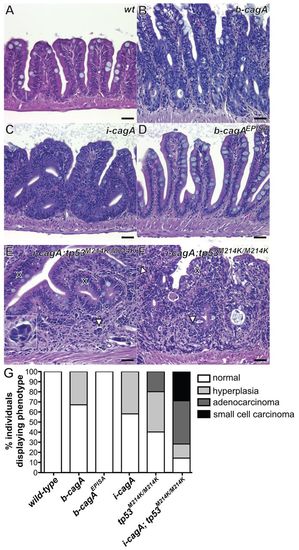
CagA expression causes phosphorylation-dependent intestinal epithelial hyperplasia and induces adenocarcinoma formation in combination with p53 loss. (A–F) H&E stained sagittal sections of adult zebrafish intestine (A) Wild-type intestine at 18 months post-fertilization (mpf) showing normal intestinal architecture, with a single layer of epithelial cells lining the mucosal folds. (B,D) b-cagA (B) and i-cagA (D) intestines at 12 mpf, displaying mucosal fold epithelial hyperplasia, dysplasia within mucosal sulci and mucosal fold fusion. (C) b-cagAEPISA intestine at 12 mpf showing normal intestinal architecture, identical to wild-type. (E) i-cagA; tp53M214K/M214K small cell carcinoma with small nests of neoplastic cells in the lamina propria (arrowheads). Inset depicts higher magnification of tumor cells; the cross marks the epithelium. (F) i-cagA; tp53M214K/M214K adenocarcinoma, poorly differentiated, invade into the lamina propria with complete disorganization of the epithelium, as shown by goblet cells randomly scattered throughout (arrowheads). (G) Summary of intestinal histological abnormalities observed in adult CagA-expressing animals as a result of a blinded histological analysis of H&E stained sections (wild-type, n=22; b-cagA, n=24; b-cagAEPISA, n=18; i-cagA, n=19; tp53M214K/M214K, n=5; i-cagA/tp53M214K/M214K, n=7). Scale bars: 25 μm.
|
