
Fig. S3
- ID
- ZDB-FIG-130625-47
- Publication
- Lu et al., 2013 - A Novel Anti-Tumor Inhibitor Identified by Virtual Screen with PLK1 Structure and Zebrafish Assay
- Other Figures
- All Figure Page
- Back to All Figure Page
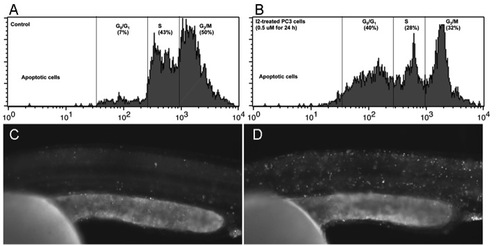
Cell cycle and apopotosis analysis in I2 treated cells and zebrafish embryo. A. PC-3 cells treated with DMSO and B. PC-3 cells treated with 0.5μM I2. C. Zebrafish embryo treated with DMSO and D. treated with I2. Bright fluorescence represents apopototic cells. To conduct cell cycle analysis by propidium iodide (PI) staining in I2-treated PC-3 cells, PC-3 cells were treated with I2 at dose of 0.5 μM for 24 hours, using PBS as control. Treated cells were trypsinized, suspended in complete DMEM medium, centrifuged at 1,500 rpm for 5 min, and the pellet was suspended in PBS. After fixing the cells in 4% paraformaldehyde for 16 hours at 4 °C, the cells were transferred into PBS containing PI (50 !g/ml), RNase A (0.1 mg/ml) and Triton X-100 (0.05%, w/w). After incubation for 60 min at 37°C, the cells were collected down by centrifuge and washed by PBS for another time. Cells were analyzed by SCAN flow cytometer (Becton Dickinson, Mountain View, CA) using mean FL-2 to assess PI fluorescence. Zebrafish embryos were treated with I2 (5μM) from late gastrulation stage and stained with acridine orange to detect apoptosis in living embryos at 24 hpf. Acridine orange was dissolved in Holtreter’s buffer (5 mg/ml) and embryos were stained at 5 μg/ml for 30 min in Holtreter’s buffer followed by washing embryos three times with the same buffer for 5 min each and imaging under a fluorescence microscope |