
Fig. 6
- ID
- ZDB-FIG-130503-40
- Publication
- Yuan et al., 2013 - A Novel PEGylated Liposome-Encapsulated SANT75 Suppresses Tumor Growth through Inhibiting Hedgehog Signaling Pathway
- Other Figures
- All Figure Page
- Back to All Figure Page
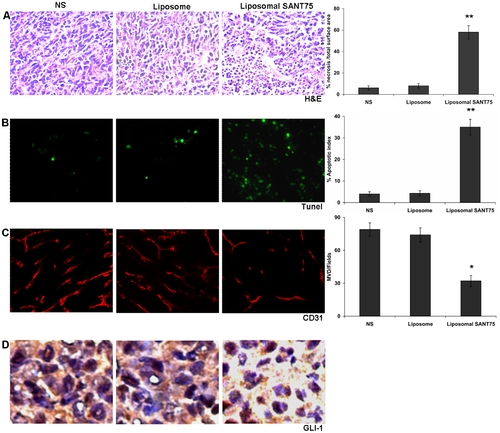
Histochemical analysis of tumor tissues in the normal saline group, free liposome group and liposomal SANT75 group. (A) H&E staining of the tumor tissues in each treatment group. Data represent the mean necrosis index ± SDs of cancer cells. Columns, mean; bars, SD. **, P<0.01, significantly different from the normal saline or liposome group. (B) TUNEL staining of the tumor tissues in each treatment group. Data represent the mean apoptotic index ± SDs of cancer cells. Columns, mean; bars, SD. **, P<0.01 significantly different from the normal saline or liposome group. (C) Inhibition of angiogenesis assayed by immunofluorescence staining with CD31. The number of vessels was counted as described in the methods. Columns, mean; bars, SD. *, P<0.05 liposomal SANT75 group versus the normal saline or liposome group. (D) The Gli-1 expression by immunohistochemical detection in each treated tumor tissues. |