
Fig. 6
- ID
- ZDB-FIG-130409-13
- Publication
- Zhang et al., 2013 - Control of hematopoietic stem cell emergence by antagonistic functions of ribosomal protein paralogs
- Other Figures
- All Figure Page
- Back to All Figure Page
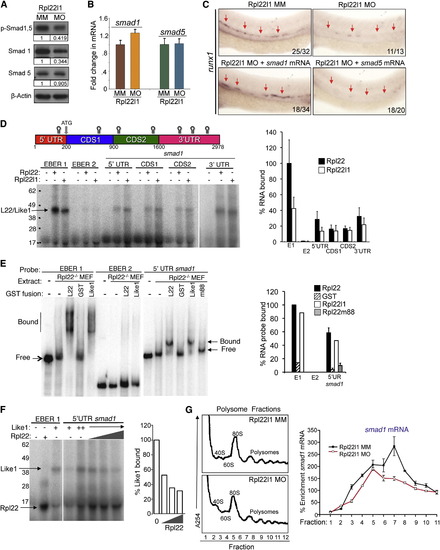
The Blockade of HSC Emergence in rpl22l1 Morphants Results from Reduced Smad1 Expression (A and B) Effect of Rpl22l1 knockdown on Smad expression. The expression levels and phosphorylation of Smad1 and Smad5 were measured by immunoblotting of controls and rpl22l1 morphants at 24 hpf. β-actin was used as a loading control. Band intensity relative to control is indicated. (B) smad1 and smad5 mRNA levels were quantified by real-time PCR and normalized to b-actin, after which the mean ± SD was depicted graphically. (C) Complementation of the arrest in HSC emergence in rpl22l1 morphants by Smad1. The indicated mRNAs (100 pg) were injected in rpl22l1 morphants after which the emergence of HSC was evaluated by WISH using a runx1 probe. Images depict phenotypes representative of at least three separate experiments, with numbers referring to the fraction of morphants with the depicted phenotypes. (D–F) Analysis of binding of smad1 mRNA by Rpl22 and Rpl22l1. (D) Schematic depicting the location in smad1 mRNA of Rpl22/Rpl22l1 binding sites predicted using M-Fold. The indicated radiolabeled mRNA probes were incubated with GST-hRpl22 (Rpl22) or GST-mRpl22l1 (Rpl22l1), after which binding was assessed by RPA. Binding was quantified by phosphorimagery, normalized to the level of Rpl22 binding to EBER1 (E1, positive control), and the mean ± SD depicted graphically (right). EBER2 (E2) served as a negative control. (E) Binding of Rpl22, Rpl22l1, and RNA-binding mutant Rpl22 (m88) to the 52 UTR of smad1 mRNA was assessed by EMSA in which detergent extracts of Rpl22/ MEF were supplemented with the indicated fusion proteins. Positions of bound and free probes are marked. The fraction of bound probe was quantified by phosphorimagery and represented graphically as above. Results represent the mean ± SD of three experiments performed. (F) Rpl22 competes with Rpl22l1 for binding to the 52UTR of smad1 mRNA. RPA analysis was performed with GST-Rpl22l1 as in (D), except that a smaller His-tagged Rpl22 fusion protein was added in increasing amounts to determine if it could displace bound GST-Rpl22l1. The bands corresponding to GST-Rpl22l1 (Like1) and His-Rpl22 (Rpl22) are indicated. The fraction of Rpl22l1 bound to smad1 RNA in the presence of increasing quantities of Rpl22 was quantified and depicted graphically as a fraction of that bound in the absence of Rpl22. (G) Polysome analysis of rpl22l1 morphants. Detergent extracts of 24hpf control (MM) or rpl22l1 morphant embryos were fractionated by ultracentrifugation on a sucrose gradient. The position of monosomes and polysomes was identified by monitoring O.D.254. smad1 RNA content of each fraction was quantified by real-time PCR and normalized to gapdh as well as the level in unfractionated extract, which was defined as 100%. The mean of triplicate samples ± SD is depicted graphically on the right. All results of representative of at least three experiments performed. |
Reprinted from Developmental Cell, 24(4), Zhang, Y., Duc, A.C., Rao, S., Sun, X.L., Bilbee, A.N., Rhodes, M., Li, Q., Kappes, D.J., Rhodes, J., and Wiest, D.L., Control of hematopoietic stem cell emergence by antagonistic functions of ribosomal protein paralogs, 411-425, Copyright (2013) with permission from Elsevier. Full text @ Dev. Cell