
Fig. 4
- ID
- ZDB-FIG-130307-2
- Publication
- Santos-Ledo et al., 2013 - Comparative gene expression analysis of the fmnl family of formins during zebrafish development and implications for tissue specific functions
- Other Figures
- All Figure Page
- Back to All Figure Page
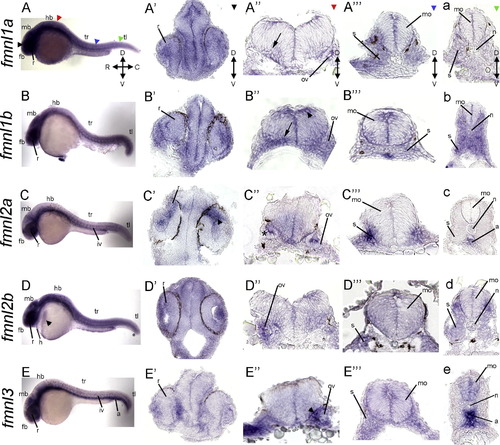
Expression of fmnls at 24 hpf reveals overlapping and distinct patterns. (A-E) Whole mount lateral views. Colored triangles indicate level of cross sections: black indicates forebrain (fb; A′-E′), red at the level of the hindbrain (hb; A′′-E′′), blue denotes sections through the trunk (tr; A′′′-E′′′), and green indicates sections through the tail (tl; a-e). fmnl1a and fmnl1b were detected in the ventral hindbrain in a fibrous-like pattern (arrows in A3 and B3). fmnl1b expression in the dorsal hindbrain (arrowhead in B′′); fmnl2a in the dorsal retina (r) (arrowhead in C′), otic vesicle (ov) (asterisk in C′′) and somites; fmnl2b in the hatching gland (arrowhead in D), the heart (h) and the lens and fmnl3 in the aorta (a), the ov (arrowhead in E′′) and somites (s). Orientation is conserved for all the whole mount and section images. C, caudal; D, dorsal; mb, midbrain; mo, medulla oblongata; n, notochord; iv, intersomitic vessels; R, rostral; V, ventral. |
| Genes: | |
|---|---|
| Fish: | |
| Anatomical Terms: | |
| Stage: | Prim-5 |
Reprinted from Gene expression patterns : GEP, 13(1-2), Santos-Ledo, A., Jenny, A., and Marlow, F.L., Comparative gene expression analysis of the fmnl family of formins during zebrafish development and implications for tissue specific functions, 30-37, Copyright (2013) with permission from Elsevier. Full text @ Gene Expr. Patterns