
FIGURE
Fig. 3
- ID
- ZDB-FIG-130307-1
- Publication
- Santos-Ledo et al., 2013 - Comparative gene expression analysis of the fmnl family of formins during zebrafish development and implications for tissue specific functions
- Other Figures
- All Figure Page
- Back to All Figure Page
Fig. 3
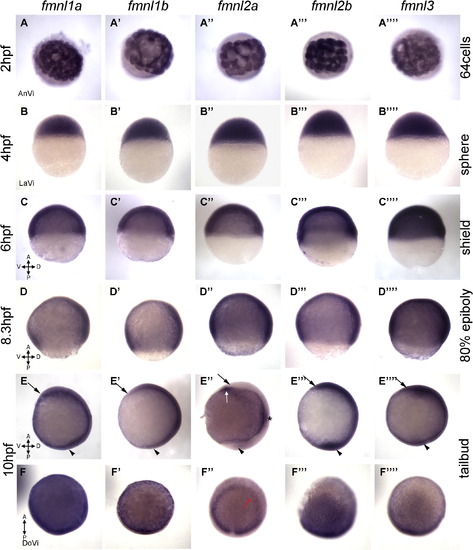
Expression of fmnl transcripts in blastula and gastrula. (A and B) Maternal expression of fmnls (1-4 hpf) and (C-F) expression during gastrulation (5-10 hpf). (E and F) Tailbud stage (Tb). The head is indicated by an arrow and the tailbud by an arrowhead. fmnl2a expression in the otic vesicle primordia (asterisk in E′′), the neuroectoderm border (red arrow in F′′) and in the hatching gland (white arrow in 3E′′). A, anterior; AnVi, anterior view; D, dorsal; DoVi, dorsal view; LaVi, lateral view; P, posterior; V, ventral. |
Expression Data
| Genes: | |
|---|---|
| Fish: | |
| Anatomical Terms: | |
| Stage Range: | 64-cell to Bud |
Expression Detail
Antibody Labeling
Phenotype Data
Phenotype Detail
Acknowledgments
This image is the copyrighted work of the attributed author or publisher, and
ZFIN has permission only to display this image to its users.
Additional permissions should be obtained from the applicable author or publisher of the image.
Reprinted from Gene expression patterns : GEP, 13(1-2), Santos-Ledo, A., Jenny, A., and Marlow, F.L., Comparative gene expression analysis of the fmnl family of formins during zebrafish development and implications for tissue specific functions, 30-37, Copyright (2013) with permission from Elsevier. Full text @ Gene Expr. Patterns