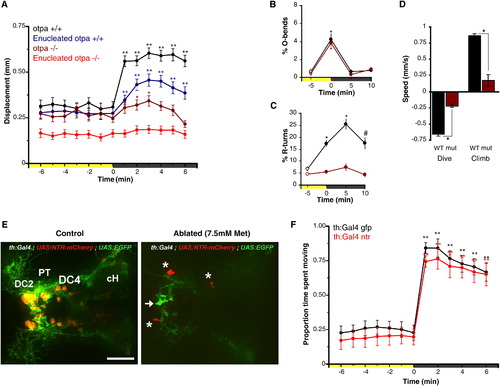
Reduction of VMR in otpa Mutants and Lack of Dopaminergic Contribution(A) Locomotor activity during dark-induced VMR of intact and enucleated otpa mutants and sibling larvae. Intact mutants show a response to light extinction (repeated-measures ANOVA; F3.0,175 = 8.5, p < 0.01; n = 59 larvae) that is greatly reduced relative to controls (intact siblings: n = 47 larvae; enucleated siblings: n = 97 larvae). Without eyes, mutants lose any response to light extinction (repeated-measures ANOVA; F3.2,317 = 1.72, p = 0.16; n = 101 larvae). Data represent mean activity for the preceding minute. Color along x axis indicates light condition. Pairwise comparisons to baseline time point at 0 min: p < 0.05, p < 0.01.(B and C) Kinematic analysis of photokinesis in intact otpa mutants. Otpa mutants retain O-bend responses to light extinction (B) (repeated-measures ANOVA; F3,9 = 53.7; p < 0.001; n = 4 groups of 10 larvae) but do not show characteristic increases in R-turn initiation (C) (mutants, red; siblings, black) (F3,9 = 2.1; p = 0.17; n = 4 groups of 10 larvae). #p < 0.05, p < 0.01 for pairwise comparisons to baseline at 5 min (empty circles). Data represent the mean and SEM of observations during the first 16 s following each time point.(D) Diving and climbing speed of intact otpa mutant larvae. Compared to siblings, otpa mutants exhibit significantly reduced diving speed during and climbing speed following a 60 s dark flash (t test; dive: p < 0.001; climb: p < 0.005; n = 3 groups of 8 larvae). Data represent mean and SEM swim speed over first 20 s of dive and ascent.(E) Nitroreductase-mediated ablation of dopaminergic (DA) neurons in Tg(BACth:Gal4VP16)m1233; Tg(UAS:EGFPCAAX); Tg(UAS-E1b:NfsB-mCherry) triple-transgenic larvae. Asterisk indicates mCherry aggregates remaining from ablated cells. Arrow indicates GFP-expressing nonablated cells. The following abbreviations are used: DC2 and DC4, Otp-dependent dopaminergic groups 2 and 4; PT, posterior tuberculum; cH, caudal hypothalamus. Dorsal view is shown. Scale bar represents 50 μm.(F) VMR in DA neuron-ablated larvae. Control Tg(th:Gal4VP16); Tg(UAS:EGFPCAAX) (black line) and DA neuron-ablated Tg(th:Gal4VP16); Tg(UAS-E1b:NfsB-mCherry) (red line) larvae show similar, robust VMR following light extinction (repeated-measures ANOVA; F12, 564 = 148.29, p < 0.001; n = 48 larvae). Data represent mean and SEM activity as in (A). Pairwise comparisons to baseline time point at 5 min: p < 0.05, p < 0.01.See also Figure S2.
|
