
Fig. 1
- ID
- ZDB-FIG-121205-38
- Publication
- Garnett et al., 2012 - BMP, Wnt and FGF signals are integrated through evolutionarily conserved enhancers to achieve robust expression of Pax3 and Zic genes at the zebrafish neural plate border
- Other Figures
- All Figure Page
- Back to All Figure Page
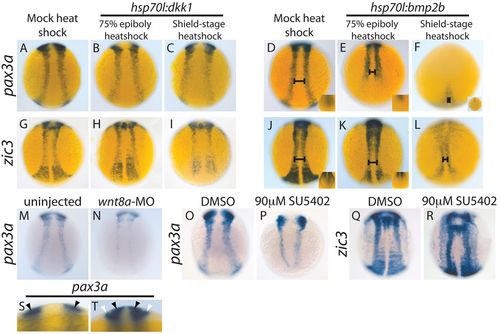
BMP and Wnt signaling regulate pax3a and zic3, and FGF signaling regulates pax3a during late gastrulation. (A-C,G-I) pax3a and zic3 expression decreases upon heat shock-mediated dkk1 overexpression. pax3a and zic3 expression decreases slightly in hsp70l:dkk1 embryos heat shocked at 75% epiboly [pax3a, B versus A (81%, n=27); zic3, H versus G (93%, n=28)] and a shield stage heat shock leads to a greater decrease in expression [pax3a, C versus A (92%, n=49); zic3, I versus G (100%, n=33)]. (D-F,J-L) pax3a and zic3 expression in the NPB decreases and shifts medially upon heat shock-mediated bmp2b overexpression. A 75% epiboly heat shock leads to a loss of posterior NPB expression (E versus D and K versus J, insets) and a slight medial shift of the anterior NPB domain (D,E,J,K, bars) (pax3a, 100%, n=22; zic3, 94%, n=18). A shield stage heat shock leads to a drastic decrease in pax3a and zic3 expression throughout the anterior-posterior axis, and NPB expression shifts medially into a teardrop shape [pax3a, F versus D (100%, n=28); zic3, L versus J (100%, n=39)]. (M,N) Morpholino-mediated knockdown of wnt8a leads to a greater decrease in pax3a expression than does dkk1 overexpression [N versus M (90%, n=20)]. (O-R) Inhibition of FGF signaling by SU5402 treatment beginning at 7 hpf leads to a decrease in pax3a expression by 12 hpf (84%, n=44) (P versus O). The same SU5402 treatment does not decrease NPB zic3 expression (100%, n=27) (R versus Q). (S,T) Optical cross-sections allow the distinction between NPB and mesodermal pax3a expression. An optical cross-section of the trunk at ~12 hpf reveals pax3a expression in the ectoderm only (black arrowheads, S), whereas an optical cross-section slightly later reveals pax3a mRNA in the ectoderm (black arrowheads, T) and paraxial mesoderm (white arrowheads, T). The insets in D-F,J,K are posterior dorsal views, all other pictures are dorsal trunk views with anterior upwards. |