
Fig. 4
- ID
- ZDB-FIG-121031-4
- Publication
- Andersen et al., 2012 - Centrosome movements in vivo correlate with specific neurite formation downstream of LIM homeodomain transcription factor activity
- Other Figures
- All Figure Page
- Back to All Figure Page
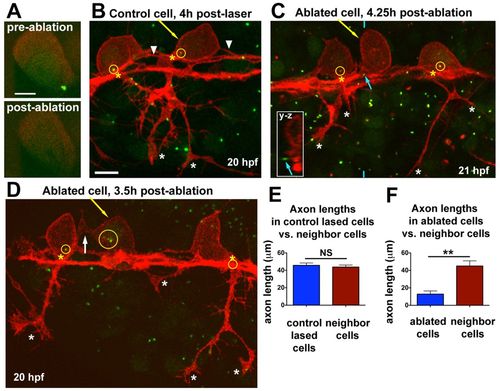
Centrosome ablation causes RB peripheral axon defects and ectopic protrusions. (A) Single optical section showing centrosome (labeled with GFP-Xcentrin) before and immediately after laser ablation. (B-D) z-projections of RB neurons (red) in Tg(–3.1ngn:tagrfp-caax) zebrafish embryos during phase III, overlaid with partial z-projections of GFP-Xcentrin (green) containing the z-planes spanning the cell body of interest. Yellow arrows indicate lased cells, yellow circles show centrosomes within neurons, and yellow asterisks indicate the PAS. (B) Control cell lased away from the centrosome shows normal cell morphology. White asterisks indicate peripheral axon branches of lased cell. Arrowheads indicate central axons. The central axons of neighboring cells are also in view. (C) RB neuron with ablated centrosome lacks a peripheral axon. Blue arrow indicates centrosome outside lased cell, shown in yz cross-section taken at the position of the blue hatch mark (inset). White asterisks indicate peripheral axon branches of non-lased cells. (D) RB neuron with fragmented centrosome lacks a peripheral axon. White arrow indicates an ectopic protrusion from the cell body. Peripheral axons of non-lased cells extend normally (white asterisks). The centrosome of the neuron on the right is obscured by other central axons at the PAS. (E) Mean (±s.e.m.) axon length: control-lased cells, 45.7±2.7 μm; neighbors, 43.8±2.3 μm; NS, not significant (P=0.64, paired t-test). (F) Mean axon length: ablated cells, 12.8±3.7 μm; neighbors, 45.1±5.9 μm; **P=0.0018, paired t-test. Axons from neighboring cells and control cells often extended out of the imaging field and thus their lengths are an underestimate. Control-lased and centrosome-ablated axon lengths are also significantly different from each other (P<0.0001, unpaired t-test). Scale bars: 5 μm in A; 10 μm in B-D. |