
Fig. 4
- ID
- ZDB-FIG-121025-9
- Publication
- He et al., 2012 - How variable clones build an invariant retina
- Other Figures
- All Figure Page
- Back to All Figure Page
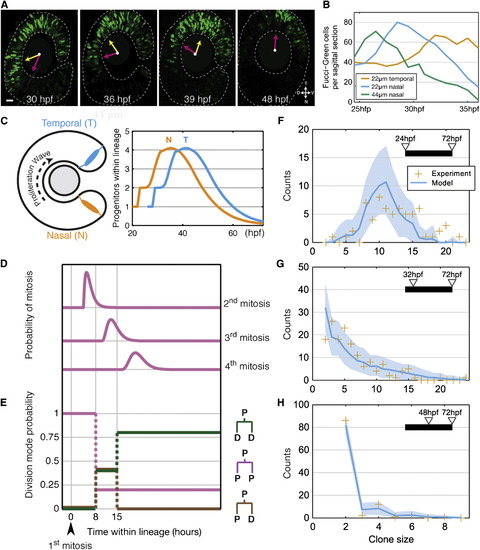
Stochasticity in Retinal Clone Growth (A) Sagittal slices of a geminin-GFP-expressing retina at various time points (yellow arrow points to region of highest number of mAG-zGem-labeled RPCs and magenta arrow points to region of geminin-GFP decline. (B) Quantified geminin-GFP-positive cells over time by zone (nasal or temporal zone) and depth (the distance between the most peripheral section and the section of interests). (C) Schematic showing the progression of the proliferative wave from the nasal region to the temporal region. On the right is plotted how the stochastic model (see Experimental Procedures) predicts the average number of progenitors derived from a single RPC as a function of time and nasotemporal position in the retina. (D) The probabilities in the model for the second, third, and fourth mitosis within a lineage to occur, measured against the first mitosis. (E) The time-dependent probabilities for modes of division of RPCs in the model. (F–H) Shows fits between model predictions (cyan lines with shaded blue regions show 95% plausible intervals due to finite sampling) and size distributions (orange crosses) of clones induced at 24 hpf (F), 32 hpf (G), and 48 hpf (H). |