|
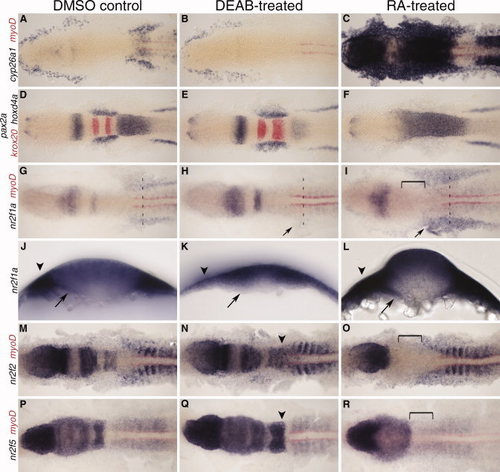
nr2f expression at 12 hours post fertilization (hpf) with retinoic acid (RA) and DEAB treatment 8–10 hpf. A–C: Expression of RA target gene cyp26a1 to confirm treatment efficiency, co-stained with myoD (red) to mark the myotome. D–F: MHB and hindbrain markers pax2a, krox20 (red), and hoxd4a show changes in tissue specification. G–I: nr2f1a expression. Arrow indicates changes in lateral plate mesoderm (LPM) expression. J–L: Transverse sections showing changes in nr2f1a transcript levels in the endoderm (arrows) and LPM (arrowheads) at anteroposterior levels designated by dashed lines in G–I. M–O: nr2f2 expression. P–R: nr2f5 expression. N,Q: Arrowheads indicate a posterior extension of hindbrain expression. Brackets indicate loss of hindbrain expression.
|