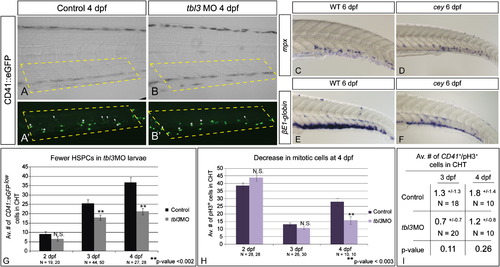
Loss of HSPCs differentially affects hematopoietic lineages.CD41::eGFPlow labels HSPCs (A, A′ white arrowheads) while CD41::eGFPhigh labels thrombocytes (A, A′ white asterisks) in the CHT of 4 dpf larvae. HSPCs (white arrowheads) are severely reduced in tbl3 morphants at 4 dpf (B, B2) as compared to uninjected wild-type controls (A, A′). In contrast, thrombocytes in tbl3 morphants are unaffected (A, A′, B, B′). There are 24.9+/- 10.2 thrombocytes in the CHT in wild-type (N=28 larvae), and 29+/11.8 in the CHT of cey (N=28) which is an insignificant difference (p-value=0.16). Brightfield images in (A) and (B) are the same larvae as (A2) and (B2), respectively. Dotted yellow boxes indicate area in CHT counted in G. Neutrophils labeled by mpx are unaffected in cey larvae (D) at 6 dpf as compared to wild-type (C), while red blood cells labeled by βE1-globin at 6 dpf are severely reduced in cey (E, F). The average number of HSPCs in the CHT of tbl3 morphants is normal at 2 dpf, but significantly reduced at 3 and 4 dpf (G). The average number of mitotic cells in the CHT of tbl3 morphant larvae is not significantly affected at 2 or 3 dpf, but is severely reduced at 4 dpf (H). The number of CD41::eGFPlow+/pH3+ cells is not significantly changed in the CHT of tbl3 morphant larvae at 3 or 4 dpf (I). The area of the CHT counted in (G–I) is labeled by the yellow dotted lines in (A), (A′), (B) and (B′). The error bars in (G) and (H) represent standard error of the mean. The error in (I) represents standard deviation. Scale bars are 130 μm. (For interpretation of the references to color in this figure legend, the reader is referred to the web version of this article.)
|
