
Fig. 5
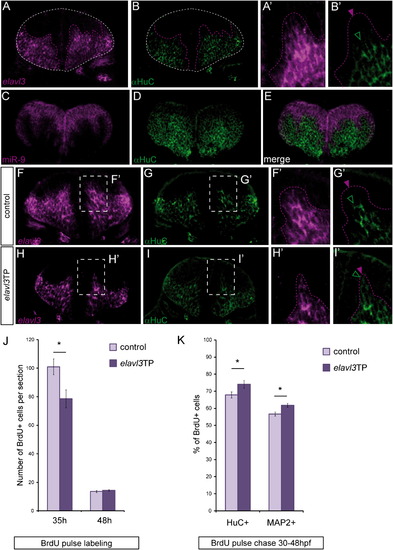
miR-9 Inhibits the Neuronal Differentiation Promoting Factor elavl3 (A–B2) Comparison of elavl3 transcripts distribution (A, purple) with a HuC expression (B, green) in a cross section through the hindbrain at 36 hpf. (A2) and (B2) are higher magnifications of the pictures shown in (A) and (B). (C–E) Comparison of miR-9 expression (purple) with HuC (green). (F–I and F2–I2) Comparison of elavl3 transcript (purple) and HuC/D protein (green) distribution between control (F, G, F2, G2) and elavl3TP injected embryos (H, I, H2, I2). Purple and green arrowheads (B2, F2, G2, H2, I2) point to the limits of respectively elavl3 transcripts and HuC protein expression domains. (J) Number of BrdU-positive cells per section after a short BrdU pulse at 35 hpf (n = 5) and 48 hpf (n = 4). (K) Proportion of HuC-positive or MAP2-positive cells among BrdU-positive cells in a BrdU pulse-chase experiment between 30 hpf and 48 hpf, in control and elavl3TP-injected embryos (n = 5 and n = 8). Values are presented as mean ± SEM. See also Figure S5. |
| Gene: | |
|---|---|
| Antibody: | |
| Fish: | |
| Knockdown Reagent: | |
| Anatomical Term: | |
| Stage: | Prim-25 |
| Fish: | |
|---|---|
| Knockdown Reagent: | |
| Observed In: | |
| Stage Range: | Prim-25 to Long-pec |
Reprinted from Developmental Cell, 22(5), Coolen, M., Thieffry, D., Drivenes, O., Becker, T.S., and Bally-Cuif, L., miR-9 Controls the Timing of Neurogenesis through the Direct Inhibition of Antagonistic Factors, 1052-1064, Copyright (2012) with permission from Elsevier. Full text @ Dev. Cell