
Fig. S3
- ID
- ZDB-FIG-120423-17
- Publication
- Dong et al., 2012 - Intralineage directional notch signaling regulates self-renewal and differentiation of asymmetrically dividing radial glia
- Other Figures
- All Figure Page
- Back to All Figure Page
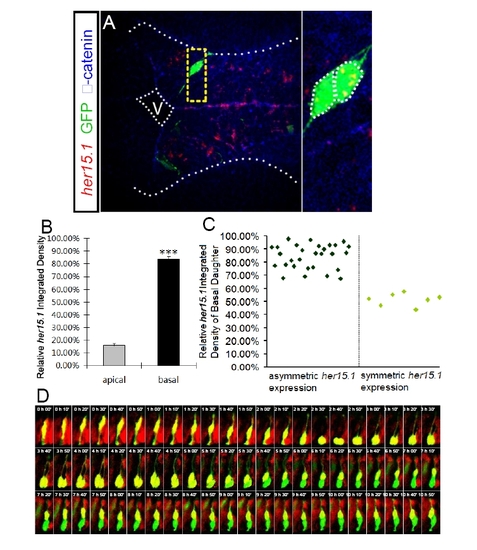
FISH coupled with clonal analyses and live imaging with her4:dRFP transgenic embryo reveal that the basal daughter cell exhibits higher Notch activity, related to Figure 4. (A) FISH of her15.1 (red) coupled with immunohistochemistry of GFP (green) and βcatenin (blue) in forebrain paired daughter cells. The profiles of each daughter cell and the apical and basal surfaces are highlighted by dashed white lines. Enlargement of the yellow-boxed area is shown on the right of each panel. V: ventricle. (B) Quantification the FISH signal of her15.1 in paired daughter cells. The relative integrated density is the ratio of the integrated density in each daughter cell to the sum of the integrated densities of both daughter cells*** p < 0.001 vs apical, t-test. (C) Scatter plot shows the relative her15.1 integrated density of the basal daughter cell of each analyzed pair of daughter cells. 29 pairs of daughter cells show asymmetric her15.1 expression, while 7 pairs of daughter cells show symmetric her15.1 expression. (D) Representative montage of sequential frames from in vivo time-lapse imaging of a single fluorescently-labeled mother cell in the developing zebrafish hindbrain of her4:dRFP transgenic embryo. The dRFP signal reveals dynamic Notch activity in the mother cell and the paired daughter cells. The following can be observed: 1) 0 – 2h 20min, the mother cell undergoes apically directed INM to reach the apical surface. The mother cell has high Notch activity, as shown by the strong dRFP signal. 2) 2h 30min - 2h 50min: The mother cell divides to generate two paired daughter cells. Notch activity is not biased in the paired daughter cells at this stage, since dRFP signal evenly distributes in the paired daughter cells. 3) 3h 00min – 4h 50min, the paired daughter cells embark on basally directed INM while maintaining their relative apical basal positions. They show similar Notch activity. 4) 5h 00min – 10h 50min: The biased Notch activity in the paired daughter cells is observed as a down-regulation of dRFP signal in the apical daughter. There also appears to be a time-dependent decrease of the overall dRFP signal in the imaged tissues, which may reflect a global down-regulation of Notch activity as development progresses, although signal bleaching due to imaging cannot be ruled out. |