
Fig. 4
- ID
- ZDB-FIG-120417-4
- Publication
- Tallafuss et al., 2012 - Turning gene function ON and OFF using sense and antisense photo-morpholinos in zebrafish
- Other Figures
- All Figure Page
- Back to All Figure Page
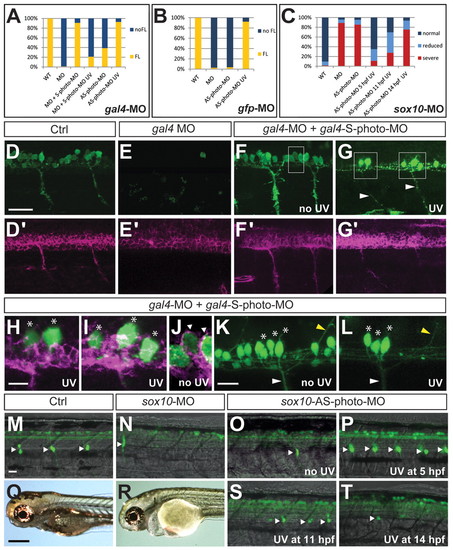
Temporal control of photo-cleavable morpholinos. (A,B) Percentage of embryos expressing fluorescent protein (FL; fluorescent, orange) compared with ‘non-glowers’ (no FL; non-fluorescent, blue). (A) Embryos injected with MOs targeting gal4 function and exposed to UV as indicated on the x-axis. WT, n=315; MO, n=179; MO+S-photo-MO, n=91; MO+S-photo-MO UV, n=99; AS-photo-MO, n=46; AS-photo-MO UV, n=90. (B) Embryos injected with MOs blocking GFP formation and exposed to UV as indicated on the x-axis. WT, n=144; MO, n=107; AS-photo-MO, n=106; AS-photo-MO UV, n=149. (C) Percentage of embryos with indicated pigment phenotype observed in sox10-MO injected embryos. MOs used and UV exposure are described on the x-axis. WT, n=81; MO, n=27; AS-photo-MO, n=58; AS-photo-MO 5hpf UV, n=44; AS-photo-MO 11hpf UV, n=48; AS-photo-MO 14hpf UV, n=35. Severe (red), no or only some pigment cells at 48 hpf; reduced (light blue), slightly diminished number of pigment cells compared with uninjected controls (normal, dark blue). (D-G2) Side view of two segments of Tg(mnx1:gal4,UAS:GFP) embryos at 26 hpf stained with anti-GFP (D-G, green), labeling all motoneurons or Alcama (D2-G2, magenta), labeling only SMNs in uninjected control embryo (D,D2), embryo injected with gal4-MO (E,E2) and embryo injected with gal4-MO/gal4-S-photo-MO (F,F2). (F) Embryos without UV exposure resemble normal GFP expression pattern. (G) GFP expression exclusively in PMNs in embryo exposed to UV at 14 hpf (G,G2). The image in G has been enhanced compared with F to improve visibility of PMN axons (see arrowheads). (H-J) High magnification of boxed regions in F (H) and G (I,J). (H,I) GFP-expressing neurons are not co-labeled with the SMN marker Alcama. (J) The margins of GFP-expressing neurons are labeled with Alcama. Arrowheads point to co-labeling of GFP (green) in the cytosol and Alcama (purple) in the membrane. (H-L) Asterisks indicate PMN cell bodies. (K,L) Live images of embryos without (K) and with (L) UV exposure. Location and axon trajectory identify GFP-expressing neurons as motoneurons. White arrowheads mark ventral projections, yellow arrowheads mark dorsal projections. Asterisks mark PMNs. (M-T) Embryos injected with sox10-MO (N-T) and uninjected control embryo (M). (M-P,S,T) Lateral views of three to four hemisegments in Tg(3.1neurog1:GFP) embryos expressing GFP in dorsal Rohon-Beard neurons and laterally located DRG neurons (arrowheads) at 3 dpf. Severely reduced number of DRG neurons in sox10-MO injected embryo (N) and sox10-AS-photo-MO injected embryo without UV exposure (O) compared with control embryo (M). UV exposure at 5 hpf leads to normal DRG development (P). UV exposure at 11 hpf leads to partial recovery of DRG formation (S), UV exposure at 14 hpf leads to severe reduction of DRG neurons (T). (Q,R) Severe reduction in pigment cells in sox10-MO injected embryo (R) compared with control embryo (Q), shown at 3 dpf. Scale bars: 30 μm for D-G2,M-P,S,T; 7.5 μm for H-J; 15 μm for K,L; 300 μm for Q,R. |