
Fig. 3
- ID
- ZDB-FIG-120417-3
- Publication
- Tallafuss et al., 2012 - Turning gene function ON and OFF using sense and antisense photo-morpholinos in zebrafish
- Other Figures
- All Figure Page
- Back to All Figure Page
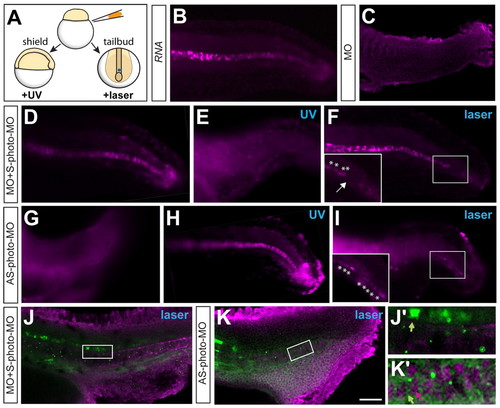
Comparison of ubiquitous or cell-specific control of ntla gene function. (A) Embryos were injected with MOs at the one-cell stage. One group of embryos was exposed to light at 5 hpf, whereas in the other group, single cells within the MPCs were exposed to light at 11 hpf using a laser. (B) Normal Ntla protein distribution in embryos injected with gfp RNA as control. (C-I) Ntla labeling in transgenic embryos Tg(hsp70:Gal4-VP16, UAS:GFP) injected with MO or photo-MOs exposure as indicated. Embryos were treated with broad spectrum light (UV), kept in dark (no text) or exposed to laser (laser) as indicated. (F) Cells with photo-cleaved ntla-S-photo-MO lack Ntla labeling (arrow). Inset shows magnification of boxed area. Asterisks highlight Ntla expression in non-exposed cells. (I) Cells with photo-cleaved ntla-S-photo-MO show Ntla labeling, marked by asterisks. Inset shows magnification of boxed area. (J-K2) Embryos labeled for GFP (green) and Ntla (magenta) highlight cell fate of light exposed cells. J2 and K2 show higher magnifications of the boxed regions in J and K, respectively. (J2) Green arrow points to an fp cell (fluorescein, green). (K2) Green arrow indicates fluorescein labeling in cytosol and magenta arrow indicates Ntla labeling in the nucleus within cells in the nc. Scale bar: 50 μm. |