
Fig. S4
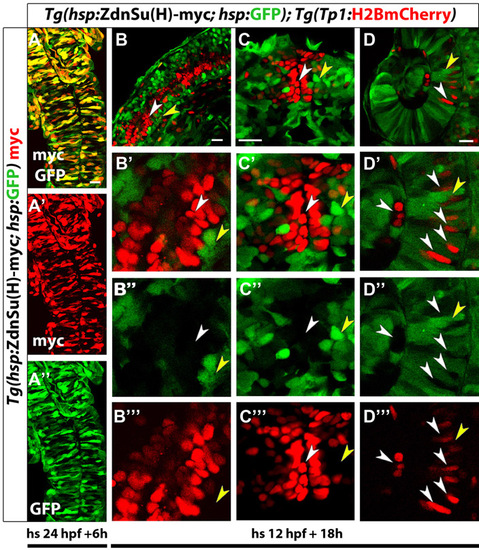
Validation of Tg(hsp:ZdnSu(H)-myc; hsp:GFP) as a tool for downregulation of Notch signaling. (A) Embryos obtained from in-crossing (Tg(hsp:ZdnSu(H)-myc; hsp:GFP) parents were heat shocked at 24 hpf, fixed at 30 hpf and stained for Myc. The majority of the cells in the neural tube co-express Myc and GFP (projection of several planes). (B-D) Embryos obtained from crossing Tg(hsp:ZdnSu(H)-myc; hsp:GFP) and Tg(Tp1:H2BmCherry) parents were heat shocked at 12 hpf and examined at 30 hpf for GFP and Tg(Tp1:H2BmCherry) expression. (B) A single plane through the neural tube. GFP+ cells show no or low expression of Tg(Tp1:H2BmCherry), indicating that they had impaired capacity to activate Notch signaling. To visualize the cells better, high-magnification single planes are shown in B2-B222. White arrowheads indicate individual Tg(Tp1:H2BmCherry)+ cells. Yellow arrowheads indicate individual GFP+ cells. Note that in most cases, the two cell types are mutually exclusive. Analogous observations were made in the brain (C) and retina (D). The images in A and C are dorsal views, anterior towards the top. The images in B and D are lateral views, anterior towards the top, ventral towards the right. Scale bars: 20 μm. |