
Fig. S3
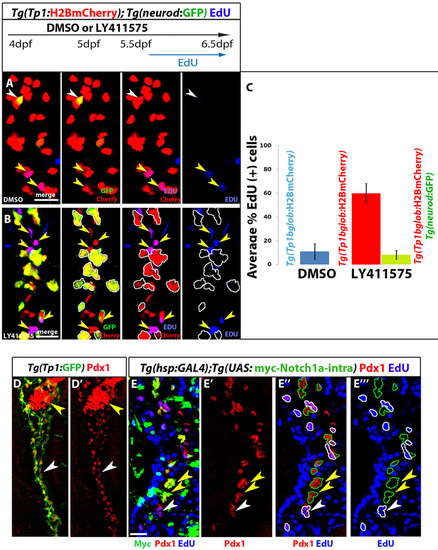
Endocrine differentiation of NRCs leads to cell cycle exit; NICD overexpression inhibits cell cycle progression. (A-C) Tg(Tp1:H2BmCherry); Tg(neurod:EGFP) larvae were used to label NRCs (red) and follow endocrine differentiation (green). (A-C) Larvae treated with DMSO or 10 μM LY411575 from 4 to 6.5 dpf (60 hours); EdU was added after a 36-hour delay (5.5 to 6.5 dpf). (A) DMSO-treated control larvae. Yellow arrowheads indicate EdU+ NRCs and white arrowheads indicate one endocrine cell along the IPD (projection of several planes). (B) LY411575-treated larvae show an increase in the number of new endocrine cells (green and red). For clarity, the positions of the endocrine cells are indicated by white outlines. Note that these endocrine cells are EdU-. EdU incorporation, however, can be observed in the NRCs that do not undergo endocrine differentiation (yellow arrowheads) (projection of several planes). (C) Quantification of average proportion of EdU+ cells for A and B. Blue bar: on average 11% of NRCs in DMSO controls were EdU+ (100 cells counted in 5 larvae). Red bar: in LY411575-treated larvae, on average 60% of NRCs not undergoing endocrine conversion were EdU+ (140 cells counted in 7 larvae) (P<0.001). Green bar: only 8% of new endocrine cells were EdU+ (182 cells counted in 4 larvae), indicating that endocrine differentiation leads to a proliferation block. (D) Tg(Tp1:eGFP) larvae were fixed at 4.5 dpf and stained for Pdx1. Pdx1 immunoreactivity is high in the endocrine cells in the PI (yellow arrowhead). Tg(Tp1:eGFP)+ NRCs extending posterior to the PI can be clearly identified based on Pdx1 immunoreactivity (white arrowheads). (E) Larvae obtained from crossing hemizygous Tg(hsp:Gal4) to hemizygous Tg(UAS:myc-Notch1a-intra) parents. Pdx1 immunoreactivity (red) marks NRCs. For clarity, all Myc+ NRCs (red and green) are outlined in green in E22 and E222. Yellow arrowheads indicate several Myc+ NRCs. None of the Myc+ NRCs are EdU+, indicating cell cycle block. By contrast, many neighboring Myc- NRCs are EdU+ (for clarity outlined in white; a white arrowhead indicates several Myc- NRCs) (projection of several planes). We found that 2.5% (118 cells counted, n=9 larvae) of Myc+ NRCs were EdU+ and 49% of the Myc- NRCs were EdU+ (235 cells counted, n=9 larvae). All images are lateral views, anterior towards the top, ventral towards the right. Scale bars: 20 µm. Error bars: s.d. |