
Fig. S3
- ID
- ZDB-FIG-120412-30
- Publication
- Idda et al., 2012 - Circadian timing of injury-induced cell proliferation in zebrafish
- Other Figures
- All Figure Page
- Back to All Figure Page
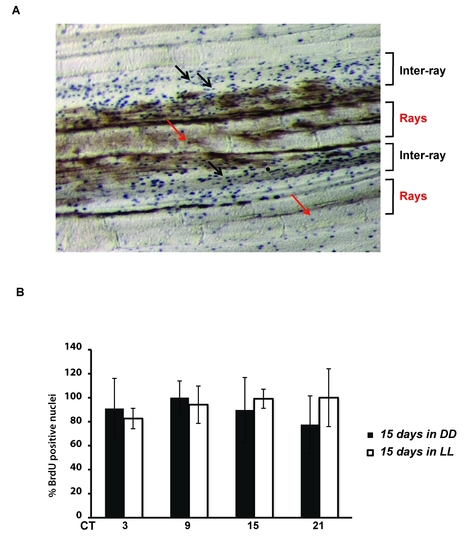
Loss of BrdU incorporation rhythms under constant conditions. (A) Representative image of BrdU staining of zebrafish caudal fin under LD conditions at ZT 9. BrdU positive nuclei (blue spots) in the inter-ray regions are indicated by black arrows. Red arrows indicate the few BrdU positive nuclei in the ray regions of the fin. (B) BrdU incorporation assays of fins sampled from fish maintained for 15 days under constant darkness (DD, black bars) or constant light (LL, white bars) and sampled at 6 hourly intervals during one subsequent 24 hours cycle (plotted as CT times). On the Y-axis is plotted the % of BrdU positive nuclei with respect to the largest value (DD, CT 9 and LL, CT15). Each time point represents the mean value +/- SEM calculated for a minimum of n = 6 fish. The data were subjected to Cosinor analysis to test for the absence of 24-h rhythmicity (see Table S1). |