
Fig. 3
- ID
- ZDB-FIG-120412-26
- Publication
- Idda et al., 2012 - Circadian timing of injury-induced cell proliferation in zebrafish
- Other Figures
- All Figure Page
- Back to All Figure Page
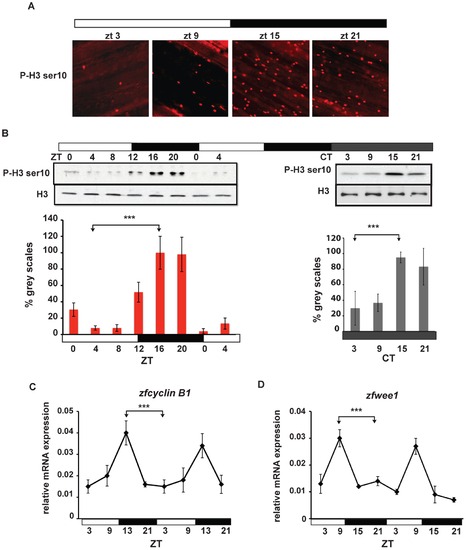
Circadian rhythms of M-phase in zebrafish fins. (A) Immunofluorescence of representative adult caudal fins stained using a phospho Histone H3 Ser 10 (P-H3 ser10) primary antibody at different zeitgeber times. (B) Western blot analysis and quantification of fin whole protein extracts in LD (left panel) and after 1 day in DD (right panel) using Histone H3 (H3) and P-H3 ser10 antibodies. On the Y-axis is plotted the values of grey-scale quantification using Scion Image software and calculated as % relative to the peak timepoint (ZT16 and CT15 respectively). (C,D) Quantitative RT-PCR analysis of two mitotic markers: zfcyclin B1 (C) and zfwee1 (D). In all experiments, the time points are indicated either as zeitgeber time (ZT) or circadian time (CT). White and black bars below each panel indicate the corresponding lighting conditions. Each experiment was performed in triplicate with a minimum of 4 fins (n = 4) for each timepoint. Data are plotted as means +/- SEM of three independent experiments. The results of statistical analysis are indicated above each graph by asterisks (Bonferroni′s post hoc test p<0.0001) and horizontal “brackets” drawn between the peak and trough values analyzed. All the quantitative data were subjected to Cosinor analysis to test for the presence or absence of 24-h rhythmicity (see Table S1, Figure S2). |