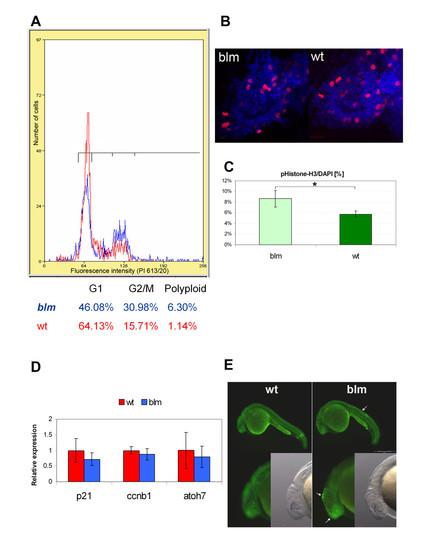
top2a mutants exhibit defects in cell cycle progression. A) Flow cytometry analysis of larvae at 27 hpf (red plot - wt, blue - blm) reveals an increased fraction of cells in G2/M phase in blm mutants. B) Representative Z-series projections showing that the total number of mitotic cells (stained with PH3 antibody - red) is lower in the eye of 27 hpf blm mutants (n = 58) than in wild type larvae (n = 70). C) The percentage of mitotic cells (PH3 positive) relative to the total number of DAPI stained cell nuclei is significantly (p = 0.036) higher in blm mutants compared to wild type as assessed from n e 23 sections through the head and spinal cord of the N = 5 mutant and wild type larvae. D) Real time PCR of cell cycle markers p21-like (G1 phase) and ccnb1 (G2/M phase) in wildtype and blm larvae at 27 hpf shows no significant difference in expression levels (p = 0.21 and 0.38, respectively). Expression of atoh7, a marker of retinogenesis, is also equivalent in eyes of blm and wildtype siblings. Presented data are average of 3 replicate experiments, each comprising pools of 16-35 larvae. Error bars represent the standard error of the mean (C-D). E) Acridine orange staining of apoptotic cells in wildtype and blm larvae at 24 hpf. Arrows point to regions of increased apoptosis in blm mutants.
|
