
Fig. 4
- ID
- ZDB-FIG-120315-32
- Publication
- Clendenon et al., 2012 - Zebrafish cadherin-11 participates in retinal differentiation and retinotectal axon projection during visual system development
- Other Figures
- All Figure Page
- Back to All Figure Page
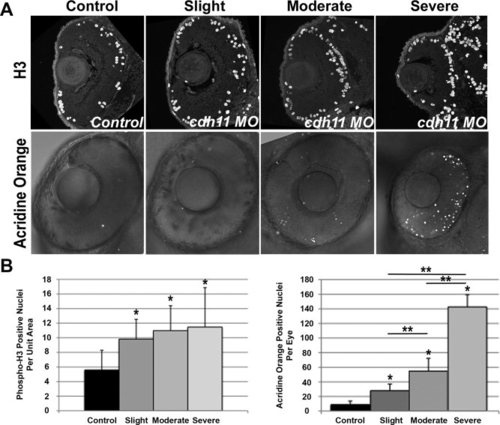
Microphthalmia is due to increased cell death in cdh11 knockdown embryos. Zebrafish embryos were injected with either standard control morpholino oligonucleotide (MO, Control) or cdh11 MO (Slight, Moderate, Severe). A: Mitotic cells were visualized in eyes of 48 hours postfertilization (hpf) embryos using histone-H3 immunostaining. Most dividing cells were found in peripheral lamina of the retina, in both control and knockdown embryos. Apoptosis was detected using acridine orange staining in eyes of 48 hpf embryos. Fluorescent nuclei were detected using confocal microscopy, and fluorescent images were overlayed on differential interference contrast transmitted light images. Increasing numbers of fluorescent nuclei were detected in embryos with increasing severity of cdh11 knockdown phenotype. Anterior is up, and lateral is left. B: Quantitative analysis of H3-positive nuclei per unit area (arbitrary units) showed a significant increased mitosis rate in cdh11 knockdown eyes. Graph shows data separated into slightly, moderately and severely affected categories using criteria outlined in the text. Error bars represent standard deviation of the mean. Control, n = 10; slight, n = 9; moderate, n = 10; severe, n = 9. Analysis of variance (ANOVA) comparisons of control vs. pooled data from all groups and control vs. slight, moderate or severe groups were significant (*P < 0.05), but the mitosis rate differences between slight, moderate or severe groups were not statistically significant. Quantitative analysis of acridine orange stained nuclei showed a significant increased apoptosis rate in cdh11 knockdown eyes. Graph shows data separated into slightly, moderately and severely affected categories using criteria outlined in the text. Error bars represent standard deviation of the mean. Control, n = 10; slight, n = 12; moderate, n = 8; severe, n = 5. ANOVA comparisons of control vs. pool data from all groups and control vs. slight, moderate or severe groups were significant (*P < 0.001), and the apoptosis rate differences between slight, moderate or severe groups were statistically significant (**P < 0.001). |
| Fish: | |
|---|---|
| Knockdown Reagents: | |
| Observed In: | |
| Stage: | Long-pec |