
Fig. 2
- ID
- ZDB-FIG-120126-75
- Publication
- Lam et al., 2011 - Toxicogenomic and phenotypic analyses of bisphenol-a early-life exposure toxicity in zebrafish
- Other Figures
- All Figure Page
- Back to All Figure Page
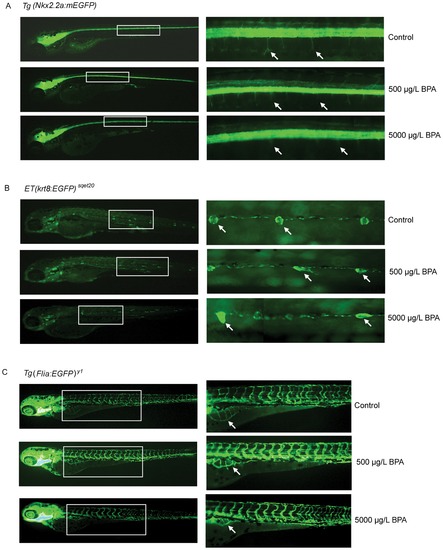
Phenotype analysis of BPA early-life exposure toxicity in GFP transgenic fish larvae. (A) Tg(Nkx2.2a-mEGFP) zebrafish larvae exposed to vehicle (control), 500 μg/L BPA and 5000 μg/L BPA. Panel on the right represent the inset region marked by white-outlined box in the corresponding left panel. White arrows indicate axon branching which are normal in control fish but marginally and severely affected in fish exposed to 500 and 5000 μg/L BPA, respectively. (B) ET(krt8-EGFP)sqet20 zebrafish larvae exposed to vehicle (control), 500 μg/L BPA and 5000 μg/L BPA. Panel on the right represent the inset region marked by white-outlined box in the corresponding left panel. White arrows indicate neuromast cells which are rosette circular-like shape in control fish but severely deformed in fish exposed to 500 and 5000 μg/L BPA. (C) Tg(Flia-EGFP)y1 zebrafish larvae exposed to vehicle (control), 500 μg/L and 5000 μg/L BPA. White arrow indicate vascularization in abdominal region which is normal in control fish but suppressed in fish exposed to 500 and (R) 5000 μg/L BPA. |
| Gene: | |
|---|---|
| Fish: | |
| Condition: | |
| Anatomical Terms: | |
| Stage: | Day 5 |
| Fish: | |
|---|---|
| Condition: | |
| Observed In: | |
| Stage: | Day 5 |