
- Title
-
Toxicogenomic and phenotypic analyses of bisphenol-a early-life exposure toxicity in zebrafish
- Authors
- Lam, S.H., Hlaing, M.M., Zhang, X., Yan, C., Duan, Z., Zhu, L., Ung, C.Y., Mathavan, S., Ong, C.N., and Gong, Z.
- Source
- Full text @ PLoS One

Phenotype analysis of BPA early-life exposure toxicity in wild-type zebrafish larvae. (A) Percentage of mortality and (B) percentage of larvae with edema when developing zebrafish were exposed to BPA at 50, 100, 500, 1500 and 4500 μg/L BPA or vehicle control for 7 days from 3 hour post-fertilization (hpf) onwards. Error bars represent mean ± SD. Asterisk indicate significant (P<0.05) differences when compared to control group (n = 4 replicate batches of embryos; each treatment group consisted of 50 embryos). Inset in (A) represents another set of acute toxicity experiment performed under similar conditions indicating percentage of mortality for developing zebrafish exposed to BPA at 500, 5000,10000, 15000 and 20000 μg/L. Representative samples of zebrafish larvae exposed to: (C) vehicle (control), (D) 50 μg/L, (E) 100, (F) 500, (G) 1500, and (H) 4500 μg/L, of BPA for 7 days from 3 hpf. Adverse toxic effects was observed at higher frequency in 1500 and 4500 μg/L of BPA which include cardiac edema (ce), cranio-facial abnormality (cf) and swimbladder (sb) development/inflation problem. Scale bar = 500 μm. PHENOTYPE:
|
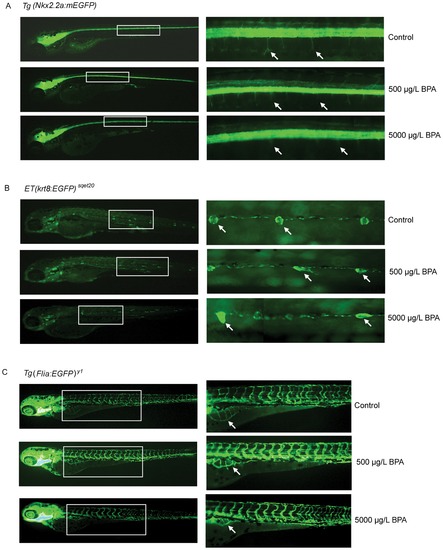
Phenotype analysis of BPA early-life exposure toxicity in GFP transgenic fish larvae. (A) Tg(Nkx2.2a-mEGFP) zebrafish larvae exposed to vehicle (control), 500 μg/L BPA and 5000 μg/L BPA. Panel on the right represent the inset region marked by white-outlined box in the corresponding left panel. White arrows indicate axon branching which are normal in control fish but marginally and severely affected in fish exposed to 500 and 5000 μg/L BPA, respectively. (B) ET(krt8-EGFP)sqet20 zebrafish larvae exposed to vehicle (control), 500 μg/L BPA and 5000 μg/L BPA. Panel on the right represent the inset region marked by white-outlined box in the corresponding left panel. White arrows indicate neuromast cells which are rosette circular-like shape in control fish but severely deformed in fish exposed to 500 and 5000 μg/L BPA. (C) Tg(Flia-EGFP)y1 zebrafish larvae exposed to vehicle (control), 500 μg/L and 5000 μg/L BPA. White arrow indicate vascularization in abdominal region which is normal in control fish but suppressed in fish exposed to 500 and (R) 5000 μg/L BPA. |

ZFIN is incorporating published figure images and captions as part of an ongoing project. Figures from some publications have not yet been curated, or are not available for display because of copyright restrictions. |
|
ZFIN is incorporating published figure images and captions as part of an ongoing project. Figures from some publications have not yet been curated, or are not available for display because of copyright restrictions. |
|
ZFIN is incorporating published figure images and captions as part of an ongoing project. Figures from some publications have not yet been curated, or are not available for display because of copyright restrictions. PHENOTYPE:
|
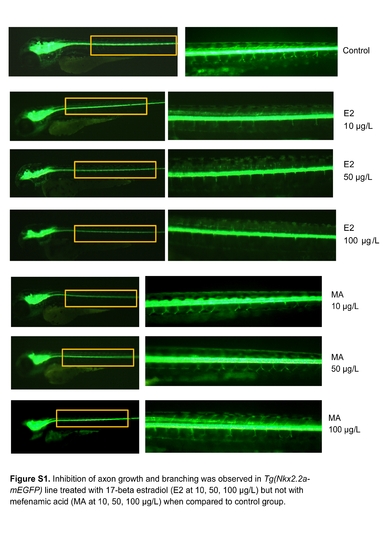
Inhibition of axon growth and branching was observed in Tg(Nkx2.2a-mEGFP) line treated with 17-beta estradiol (E2 at 10, 50, 100 μg/L) but not with mefenamic acid (MA at 10, 50, 100 μg/L) when compared to control group. |