
Fig. 1
- ID
- ZDB-FIG-111223-21
- Publication
- Herwig et al., 2011 - Distinct Cellular Mechanisms of Blood Vessel Fusion in the Zebrafish Embryo
- Other Figures
- All Figure Page
- Back to All Figure Page
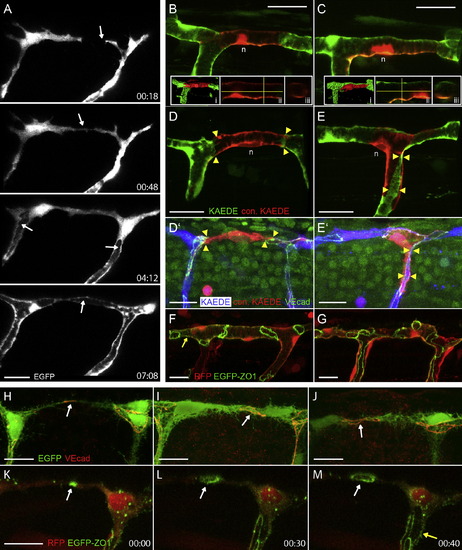
Anastomosis and Heterogeneity of Endothelial Tubes (A) Still pictures of a time-lapse movie (data not shown) showing steps during dorsal longitudinal anastomotic vessel (DLAV) formation. Tip cells reach the dorsal side of the embryo and send filopodia in anterior and posterior directions (arrow in 00:18 [hr:min]). The tip cells contact each other and form the future DLAV (arrow in 00:48). Later the lumen opens from the stalk and proceeds into the DLAV (arrows in 4:12 and 7:08). (B–G) Different vessel architectures are found in the intersegmental vessel (ISV)/DLAV. Single, photoconverted cells (red) show a unicellular (B) or a multicellular arrangement (C). Inserts (i–iii) in (B) and (C) show a surface calculation (i), a sagittal section (ii), and a cross-section (iii) at the sites indicated by cross-hairs (n = nucleus). (D–E′) Single photoconverted cells (red) and corresponding VE-cadherin (VE-cad) immunostainings. Arrowheads indicate regions of unicellular (D and D2) and multicellular (E and E2) tubes. A unicellular tube outlined by EGFP-zona occludens 1 (ZO1) fusion protein is shown in (F), and multicellular/unicellular and mixed arrangements represented by EGFP-ZO1 protein are shown in (G). The yellow arrow in (F) points at delocalized EGFP-ZO1 protein in the cell membrane, most likely due to elevated levels of protein. (H–J) VE-cad immunostainings of 30 hrs postfertilization (hpf) old fli:EGFP embryos. Spots and small and larger rings are shown in (H), (I), and (J), respectively (see arrows). (K–M) Still pictures of Movie S1 showing a time-lapse of a fli:GAL4FF; UAS:RFP; UAS:EGFP-ZO1 embryo. An initial contact spot of EGFP-ZO1 (arrow in K) is elaborated into a small (arrow in L) and subsequently into a larger loop (arrow in M; Movie S1). The yellow arrow in (M) points to delocalized EGFP-ZO1 in the cell membrane (compare F and Figure S1). Scale bar in all pictures represents 20 μm. |
| Gene: | |
|---|---|
| Antibody: | |
| Fish: | |
| Anatomical Term: | |
| Stage: | Prim-15 |