
Fig. S7
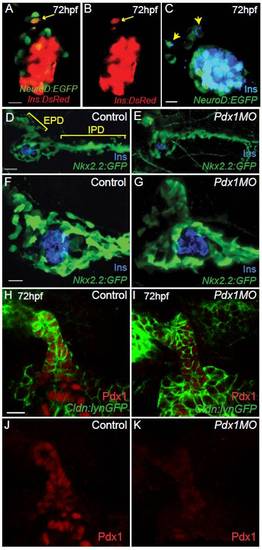
Beta cell differentiation and duct development. (A,B) Single plane, ventral view of TgBAC(NeuroD:EGFP)nl1;Tg(ins:dsRed)m1018 control embryo at 72 h post fertilization (hpf). With the red channel overexposed, anterior enhanced green fluorescent protein (EGFP)+ cells with low levels of InsDsRed can be detected (arrow). (C) Confocal projection of TgBAC(NeuroD:EGFP)nl1 embryo at 72 hpf immunostained for green fluorescent protein (GFP) and insulin (Ins). The Ins signal is overexposed to show low-expressing cells anterior to the principal islet. Scale bar = 10 μM. (D-G) Confocal projection of 84 hpf Tg(-3.5nkx2.2a:GFP)ia3 embryos immunostained for GFP and Ins. GFP expression delineates developing duct in control (D,F), and pdx1 morphant (E,G) embryos. EPD, extrapancreatic duct; IPD, intrapancreatic duct. Ventral view. Scale bar = 15 μM. (H-K) Single plane views of 72 hpf Tg(-8.0cldnb:lynEGFP)zf106 embryos immunostained for Pdx1 and GFP. Control embryos show robust Pdx1 expression in the proximal pancreas and EPD (H,J), as compared to weak expression in pdx1 morphants (I,K). (J) and (K) represent the red channel only from (H) and (I). Ventral view, anterior to left. Scale bar = 10 μM. |