
Fig. 2
- ID
- ZDB-FIG-111202-20
- Publication
- Feng et al., 2010 - T-lymphoblastic lymphoma cells express high levels of BCL2, S1P1, and ICAM1, leading to a blockade of tumor cell intravasation
- Other Figures
- All Figure Page
- Back to All Figure Page
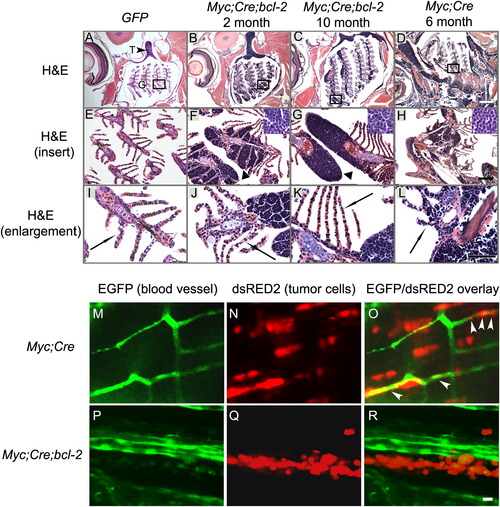
Zebrafish T-Lymphoblasts Overexpressing Bcl-2 Spread Locally but Fail to Intravasate into Vasculature (A, E, and I) T cells in a control fish are restricted to the thymus above the gill arches and underneath the operculum (n = 3). (B, C, F, G, J, and K) GFP and dsRED2-positive tumor cells (arrowheads; F,G) in the Myc;Cre;bcl-2 fish invade tissues outside the thymus and infiltrate local structures, including the primary lamellae (filaments) and cartilaginous gill rays by 2 months (B, F, and J; n = 3) but fail to invade vasculature by 10 months (C, G, and K; n = 3). (D, H, and L) By contrast, GFP- and dsRED2-expressing cells of the Myc;Cre transgenic fish (D, H, and L; n = 3) enter secondary lamellae that contain the capillary network (compare J and K with L, arrows) and disseminate widely throughout the host, infiltrating distant muscle and fat tissues by 6 months. (M, N, and O) dsRED2-expressing lymphoma cells (N) from the Myc;Cre fish intravasate into EGFP-labeled vasculature (M) of the transplant host (fli1-EGFP;Casper) by 6 day posttransplantation (see arrowheads in O). (P, Q, and R) In contrast, dsRED2-expressing lymphoma cells (Q) from the Myc;Cre;bcl-2 fish fail to intravasate vasculature (P) of the transplant hosts by 6 day posttransplantation (compare R with O). Note aggregates of the Myc;Cre;bcl-2 lymphoma cells in Q and R. Black arrowhead in (A) points to thymus (T) and the gill region is indicated (G). Inserts in (F)–(H) show enlargements of tumor cells. Scale bar for (A)–(D), 200 μm; for (E)–(H) 50 μm; for (I)–(L) and (M)–(R), 10 μm. See also Figure S2. |
| Fish: | |
|---|---|
| Observed In: | |
| Stage: | Adult |
Reprinted from Cancer Cell, 18(4), Feng, H., Stachura, D.L., White, R.M., Gutierrez, A., Zhang, L., Sanda, T., Jette, C.A., Testa, J.R., Neuberg, D.S., Langenau, D.M., Kutok, J.L., Zon, L.I., Traver, D., Fleming, M.D., Kanki, J.P., and Look, A.T., T-lymphoblastic lymphoma cells express high levels of BCL2, S1P1, and ICAM1, leading to a blockade of tumor cell intravasation, 353-366, Copyright (2010) with permission from Elsevier. Full text @ Cancer Cell