|
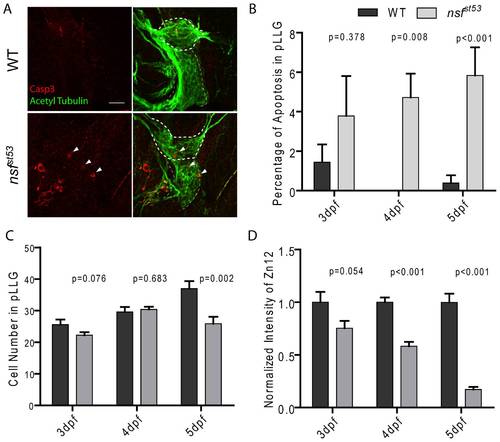
Apoptosis in nsfst53 mutants (5 dpf). Representative z-projections of the pLLG (thick dashes) and vagal ganglion (thin dashes) are shown in (A). In WT and nsfst53 mutants, apoptotic cells (arrow heads) were labeled by Casp3 antibody (red), and neurons were labeled by acetylated Tubulin antibody (green). Scale bar: 20 μm. Images shown in all panels are 6 z-stacks of 1.5 µm. B, The percentage of apoptosis in the pLLG of both wild-type and nsfst53 mutant larvae (in wild-type the percentage apoptosis are 1.4 ±0.9, n = 5, 0.0 ±0.0, n = 8 and 0.4 ±0.4, n = 8 from 3 dpf to 5 dpf respectively; 4.8 ±2.0, n = 7, 4.7 ±1.2, n = 7, and 5.8 ±1.4, n = 7 in nsfst53 mutants). C, Cell numbers of the pLLG in wild-type increased from 25.6 ±1.6, n = 5 at 3 dpf to 29.6 ±1.5, n = 5 at 4 dpf and reached 37.0 ±2.3, n = 8 at 5 dpf, while the numbers changed from 22.3 ±0.9, n = 8 to 30.4 ±0.8, n = 8 and then to 25.9 ±2.2, n = 7 in nsfst53 mutants. D, The ratio of the intensity of Zn12 labeling (Figure 3A) of nsfst53 to wild-type labeling declined from 3 dpf to 5 dpf (76.2 ±9.5, n = 6, 58.2 ±4.1, n = 5, and 17.2 ±2.4, n = 7).
|