
Fig. 4
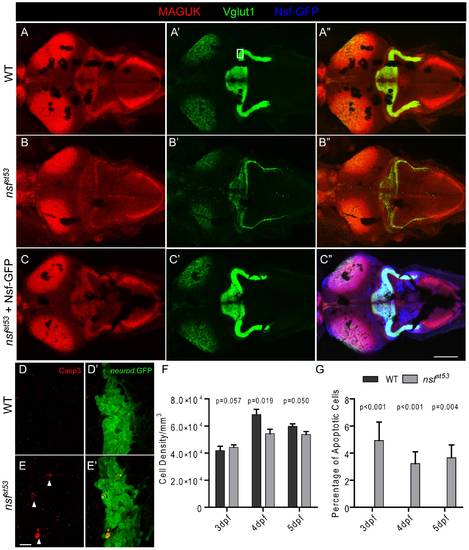
Reduction of glutamatergic synapses in the CNS of nsfst53 mutants (5 dpf). Representative z-projections of the optic tectum and cerebellar region from a top view are shown. Wild-type (A), nsfst53 mutant (B), and nsfst53 mutant in Tg(-5neurod:nsf-GFP)vo1 background (C), which expresses Nsf-GFP (Blue) in various neurons, were labeled with Vglut1 and MAGUK antibody labeling. Scale bar: 100 μm; z-projection of 15 confocal planes (10 μm each). D-E2, Magnified views from the boxed region in panel A′. Activated Caspase 3 (Casp3) antibody was used to label apoptotic cells (arrow heads) in the cerebellar region, and GFP signals from TgBAC(neurod:EGFP)nl1 fish were used to identify neurons, likely the Purkinje cells, in the cerebellum. F, Cell density (3 dpf, 41875.0±3287.4, n = 4; 4 dpf, 68500.0±3840.6, n = 5; 5 dpf, 59687.5±1856.3, n = 8 in wild-type and 3 dpf, 44285.7±1867.2, n = 7; 4 dpf, 54375.0±3264.7, n = 8; 5 dpf, 53750.0±2116.4, n = 6 in nsfst53) and (G) the rate of apoptosis in the cerebellum of wild-type (0% for 3 dpf to 5 dpf, n = 8) and nsfst53 mutants (3 dpf, 4.3±1.3%; 4 dpf, 3.2±0.9%; 5 dpf, 3.1±1.0%, n = 8). P values compare nsfst53 mutants to their wild-type siblings at the same developmental stage. |
| Antibodies: | |
|---|---|
| Fish: | |
| Anatomical Terms: | |
| Stage: | Day 5 |