
Fig. 3
- ID
- ZDB-FIG-111115-3
- Publication
- Jayasena et al., 2011 - Live imaging of endogenous periodic tryptophan protein 2 gene homologue during zebrafish development
- Other Figures
- All Figure Page
- Back to All Figure Page
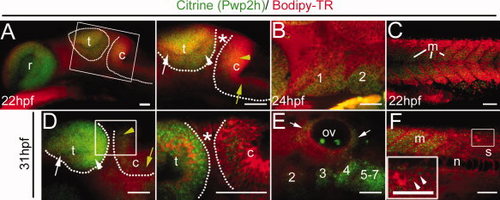
Live confocal imaging of Gt (pwp2h-citrine)ct143a homozygotes. A–F: Bodipy-TR vital dye is used to highlight all cells (red). A,C: Citrine expression at 22 hours post fertilization (hpf), in the head (A) and trunk (C); (B) 24 hpf expression in the pharyngeal arches 1 and 2; (D–F) 31 hpf expression in the head (D,E) and trunk (F). A,D: Projections of confocal z-stacks are shown. B,C,E,F: Projections of confocal z-section. A,D: Pwp2h is expressed at high levels in the tectum compared with the cerebellum. Dotted lines highlight tectum and cerebellum in the embryo. White arrowhead, high expression in the posterior tectum. White arrow, low expression in the anterior tectum. Yellow arrowhead, high expression in the cerebellum. Yellow arrow, drop in Pwp2h expression in the cerebellum. Asterisk: isthmic region. Adjacent image is magnified view of boxed region. D: The magnified view is a confocal z-section. E: Expression in the ear (arrows) and pharyngeal arches 2–7. F: Inset arrowheads: Expression in spinal cord (s) neurons (shown in boxed region). c, cerebellum; m, myotome; n, notochord; ov, otic vesicle; r, retina; t, tectum. Scale bar = 50 μm. |
| Gene: | |
|---|---|
| Fish: | |
| Anatomical Terms: | |
| Stage Range: | 26+ somites to Prim-15 |