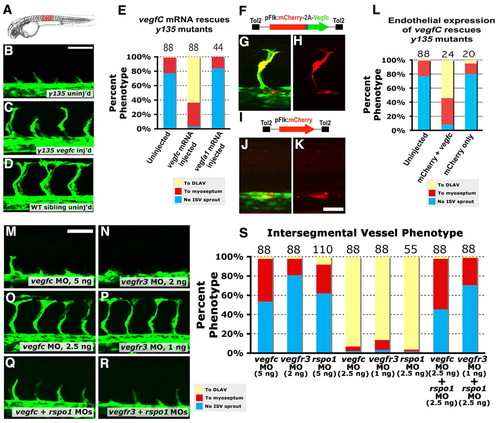
Vegfc signaling is required downstream of Rspo/Wnt signaling. (A) Diagram of a zebrafish embryo with the red box highlighting the region shown in B-D. (B-D) Confocal images of the trunk vessels in 26 hpf dtty135 mutant (B), vegfc mRNA-injected dtty135 mutant (C) and uninjected wild-type sibling (D). (E) Quantitation of ISV growth phenotypes in 26 hpf uninjected and mRNA-injected zebrafish embryos. P values according to Student’s t-test: vegfc, P<0.0001; vegfa, P<0.0187. (F-H) Rescued ISV sprouts in 26 hpf Tg(fli-EGFP)y1 dtty135 mutant zebrafish injected with a Tol2(Flk:mCherry-2a-vegfc) construct (F) for Flk promoter-driven endothelial expression of mCherry and vegfC separated by a viral 2A peptide sequence. (I-K) No rescue of ISV sprouting in 26 hpf Tg(fli-EGFP)y1 dtty135 mutant zebrafish injected with a Tol2(Flk:mCherry) Tol2 construct (I) for Flk promoter-driven endothelial expression of mCherry reporter alone. (G,J) EGFP (green) and mCherry (red) combined fluorescence image. (H,K) Same fields as in G,J, viewing mCherry fluorescence alone. (L) Quantitation of ISV growth phenotypes in 26 hpf uninjected and Tol2(Flk:mCherry-2a-vegfc) or Tol2(Flk:mCherry) DNA-injected zebrafish embryos. The bars show the percentages of ISV that have failed to sprout (blue), ISV that have grown only up to the horizontal myoseptum half-way up the trunk (red) and ISV that have grown all the way to the dorsal trunk to form the DLAV (yellow). For DNA construct-injected animals in L, only mCherry-positive ISV phenotypes were assessed. The number of segments counted is shown above each bar on the graphs. (M-R) Confocal images of trunk vessels in 26 hpf Tg(fli-EGFP)y1 wild-type zebrafish injected with either 5 ng vegfc MO (M), 2 ng vegfr3 MO (N), 2.5 ng vegfc MO (O), 1 ng vegfr3 MO (P), 2.5 ng vegfc + 2.5 ng rspo1 MO (Q) or 1 ng vegfr3 MO + 2.5 ng rspo1 MO (R). (S) Quantitation of ISV growth phenotypes in 26 hpf different MO-injected zebrafish embryos. Color coding is the same as in L. Scale bars: 50 μm in B,M; 25 μm in K.
|
