
Fig. 3
- ID
- ZDB-FIG-110929-45
- Publication
- Jayasena et al., 2011 - Live imaging of endogenous Collapsin response mediator protein-1 expression at subcellular resolution during zebrafish nervous system development
- Other Figures
- All Figure Page
- Back to All Figure Page
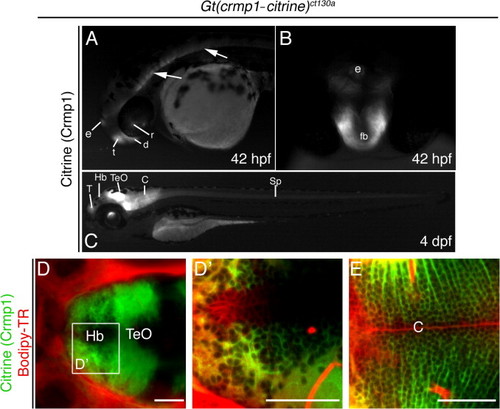
Crmp1 expression in the developing brain in live 42 hpf- 4 day fish. (A) Lateral view at 42 hpf. Crmp1 is expressed in the epiphysis (e) and forebrain regions: telencephalon (t) and diencephalons (d). Expression is also detected in the retina (r). Arrows show expression in brain and spinal cord. (B) Frontal view at 42 hpf of the forebrain (fb) and epiphysis. (C) Expression in the 4 day live larva showing expression in the T, telecephalon, Hb, habenula, TeO, optic tectum and Cb, cerebellum. Expression in spinal cord (Sp) also persists. (D–E) Larvae were treated with the vital dye Bodipy-TR (red) to act as a contrast against the citrine signal. (D) Confocal z-stack at 4 dpf, dorsal view showing expression in in Hb and TeO. (D2) Shows zoomed view but z-section. (E) Z-section at the level of cerebellum. Scale bar: 50 μm. |
| Gene: | |
|---|---|
| Fish: | |
| Anatomical Terms: | |
| Stage Range: | High-pec to Day 4 |
Reprinted from Gene expression patterns : GEP, 11(7), Jayasena, C.S., and Bronner-Fraser, M., Live imaging of endogenous Collapsin response mediator protein-1 expression at subcellular resolution during zebrafish nervous system development, 395-400, Copyright (2011) with permission from Elsevier. Full text @ Gene Expr. Patterns