
Fig. 3
- ID
- ZDB-FIG-110928-3
- Publication
- Nikitina et al., 2011 - Ancestral network module regulating prdm1 expression in the lamprey neural plate border
- Other Figures
- All Figure Page
- Back to All Figure Page
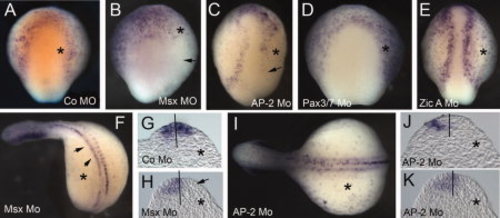
Expression of prdm1 in the neural plate border is regulated by AP-2 and Msx A. prdm1 is detected by in situ hybridization in morpholino-injected embryos. A–E: Top row: Embryonic day (E) 4.5 embryos injected with control (A) Msx A (B), AP-2 (C), Pax3/7 (D), and Zic A (E) morpholinos. All embryos are shown in dorsal view with anterior facing up. In all embryos, morpholino was incorporated into the right side (marked with an asterisk). Arrows in (B) and (C) indicate loss of prdm1 expression on the injected side. F: MsxA-morpholino-injected embryo at E8.5, showing loss of prdm1 expression in somites and reduction of expression in half of the neural tube (arrowheads). H: Section through the embryo in (F) showing loss of prdm1 expression in one half of the neural tube (arrow). G: Section through an E8.5 embryo injected with the control morpholino. I: E7.5 embryo injected with AP-2 morpholino, showing that prdm1 expression in the somites in not affected (asterisk marks the injected side). J,K: Sections through the embryo in panel I, showing loss of prdm1 expression on the injected side (asterisk). |