
FIGURE
Fig. 3
- ID
- ZDB-FIG-110720-62
- Publication
- Zhao et al., 2011 - A novel xenograft model in zebrafish for high-resolution investigating dynamics of neovascularization in tumors
- Other Figures
- All Figure Page
- Back to All Figure Page
Fig. 3
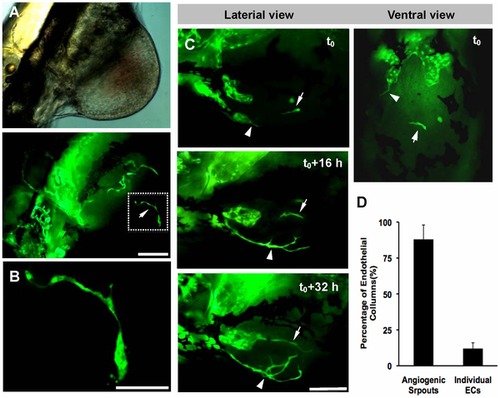
The participation of individual VEGFR2+ endothelial cells to the initial formation of tumor vascular network. Individual VEGFR2+ endothelial cells located at the center of B16 xenograft (indicated by arrow, A). The region in white dotted box was magnified in B. With the tumor growth (C), individual endothelial cells (arrows) increased its length and fused with angiogenic sprouts (arrowheads). (D) Histogram represents (n = 12, p<0.05) the percentage of endothelial columns that originated from the individual ECs or the angiogenic sprouts. Scale bar, 100 μm (A, C) or 50 μm (B). |
Expression Data
Expression Detail
Antibody Labeling
Phenotype Data
Phenotype Detail
Acknowledgments
This image is the copyrighted work of the attributed author or publisher, and
ZFIN has permission only to display this image to its users.
Additional permissions should be obtained from the applicable author or publisher of the image.
Full text @ PLoS One