
Fig. 5
- ID
- ZDB-FIG-110706-14
- Publication
- Chou et al., 2011 - Fascin 2b Is a Component of Stereocilia that Lengthens Actin-Based Protrusions
- Other Figures
- All Figure Page
- Back to All Figure Page
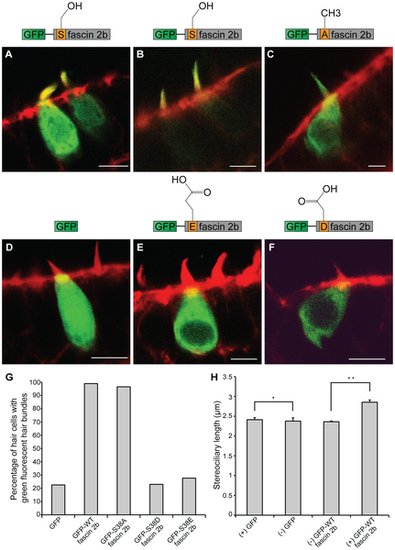
Localization patterns of wild-type or phosphomutant fascin 2b fusion proteins in hair cells, and the effect of GFP-WT fascin 2b expression on stereociliary length. Representative confocal images of transgenic hair cells in the anterior maculae of zebrafish at 4 dpf are displayed. Hair cells expressing GFP-WT fascin 2b (A,B), GFP-S38A fascin 2b (C), GFP (D), GFP-S38E fascin 2b (E), or GFP-S38D fascin 2b (F) are labeled with fluorophore-coupled phalloidin (red). The fusion proteins and GFP appear green. When high levels of GFP-WT fascin 2b are expressed in hair cells (number of cells, N = 192), the fusion protein localizes to the stereocilia and the somata (A), but when low levels are expressed, it localizes specifically to the hair bundles (B). GFP-S38A fascin 2b (N = 86) (C) localizes with a pattern that is similar to that of GFP-WT fascin 2b (A). In contrast, cells expressing GFP (N = 71) (D), GFP-S38E fascin 2b (N = 94) (E), or GFP-S38D fascin 2b (N = 74) (F) generally exhibit greatly reduced levels of GFP fluorescence in their hair bundles. Scale bars are 5 μm. Graph displays the percentage of transgenic hair cells with GFP fluorescence in their bundles for each expressed fluorescent protein (G). As represented by graph (H), cells that express GFP-WT fascin 2b ((+) GFP-WT fascin 2b, N = 132) have an increased mean hair-bundle length when compared to that of non-transgenic hair cells ((-) GFP WT-fascin 2b) in transgenic animals that mosaically express the transgene. The means of the bundle lengths of cells that lack expression of the fluorescent proteins ((-) GFP WT-fascin 2b, N = 480; (-) GFP, N = 45) and that of those that express GFP ((+) GFP, N = 148) are similar, indicating that there is no substantial experimental variation of the controls within and between the two groups. The means of the bundle lengths ± SEM are plotted. Single and double asterisks indicate P = 0.8653 and P = 0.0001, respectively, for Student′s t tests. |