
Fig. 2
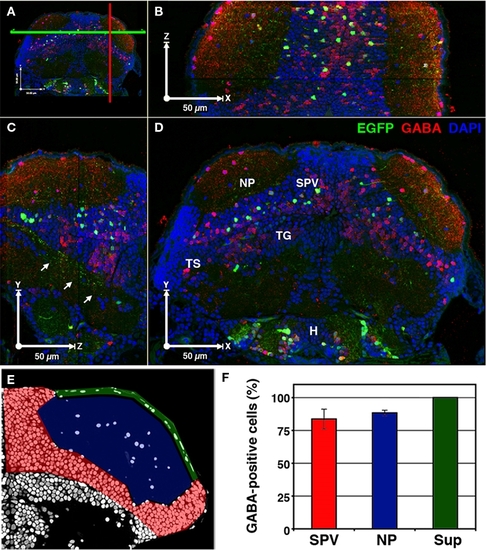
A majority of cells labeled in dlx5/6:GFP larvae are GABAergic. 3D reconstruction of a 5-dpf dlx5/6:GFP larvae that was fixed and sectioned at a thickness of 1 μm and labeled by GABA immunofluorescence and DAPI nuclear staining. (A) Colored lines indicate the relative locations of the cut-views presented in (B–D). (B) Cut-view in the XZ plane (dorsal view). (C) Cut-view in the YZ plane (sagittal). (D) Cut-view in the XY plane (coronal). Note the single-cell resolution in 3D and the high density of GABAergic cells in the periventricular cell layer (SPV) and neuropil (NP) regions of the tectum and the relative sparsity of GFP-labeled neurons. Arrows in (C) indicate axonal tracts of diencephalic and mesencephalic origins en route to the hindbrain. (E) A single section labeled with DAPI. Colored shading indicates the tectal regions defined for GABA phenotypic analysis: SPV (red), neuropil (blue), and superficial neuropil (green). (F) GABAergic phenotypic analysis in the optic tectum of 5 dpf dlx5/6:GFP larvae. Tegmentum (TG), hypothalamus (H), torus semicircularis (TS). Scale bar, 50 μm in (B–E). |