
Fig. 8
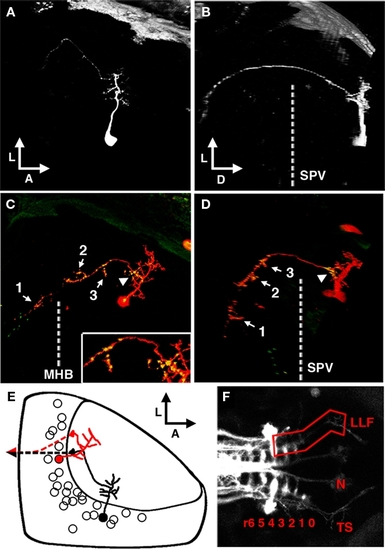
The periventricular projection neuron cell type. (A) Dorsal view of a two-photon image volume containing a single labeled PVPN imaged at 3 dpf. Note the short, sparse apical dendrite that gives rise to a single neurite that extends laterally toward the edge of the tectum. (B) Ninety degree rotation of image volume in (A). The single long process has extended ventrally out of the tectum before redirecting to extend in a postero-medial orientation. Dashed line indicates the approximate ventral extent of the SPV. (C) Merged confocal image volume of a single 5 dpf nsPVIN expressing both dsRed (red) and Syp–GFP (green). Dashed line indicates approximate location of the midbrain–hindbrain boundary. Inset: 2× magnification of region indicated by arrowhead. Note that bright Syp–GFP puncta are located in multiple regions: within the distal segment of the efferent process (arrow 1), the sparse network of collateral branches in the ventral midbrain (arrows 2–3), and a proximal segment within the tectal neuropil (arrowhead). (D) Ninety degree rotation of image volume in (C). (E) Schematic depiction of PVPN cell body distribution throughout the SPV layer. Note that a majority of these cells are located in the shallow SPV close to the neuropil. Cell traced in black correspond to neuron in (A,B). Note that the more medial cell body location necessitates an initial lateral trajectory in order to reach the edge of the tectal neuropil. In contrast, the cell in (C,D; traced in red) is located laterally, which permits a more direct exit from the tectal neuropil. Dashed line indicates descending axon trajectory after exiting the tectum. (F) Maximum projection of reticulospinal circuitry labeled by pressure injection of DiI into the spinal cord of a fixed larvae at 5 dpf. Boxed region indicates the synaptic field for PVPN efferent axons, which grow along the trajectory of the LLF, which runs from the torus TS, through the MO to the HB reticular formation (numbers indicate rhombomere position). Boxed region indicates the typical PVPN arborization field, which spans the TS, MO, and anterior hindbrain. Dashed line indicates midbrain–hindbrain boundary (MHB). Scale bar, 25 μm in (A–D), 100 μm in (E). |