
Fig. S5
- ID
- ZDB-FIG-110406-5
- Publication
- Goode et al., 2011 - Minor change, major difference: divergent functions of highly conserved cis-regulatory elements subsequent to whole genome duplication events
- Other Figures
- All Figure Page
- Back to All Figure Page
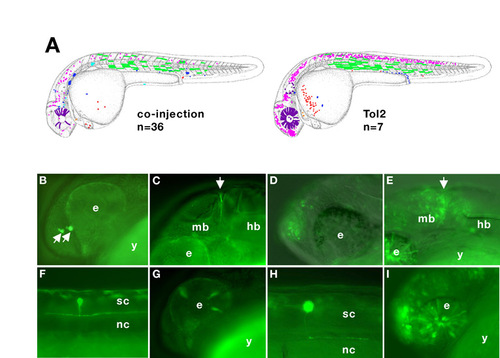
Comparison of our co-injection assay and a Tol2 cloning strategy. (A) Schematic diagrams of the expression profile of a pax2.1 CNE (CRCNE00000063-4) functionally analysed using the co-injection (left) and Tol2 cloning (right) methodology. n, the number of positive embryos used to generate these composite schematics (fewer embryos were used for the Tol2 image because many more cells were labelled per embryo). (B-I) Live images of embryos at 24 hpf (B-E,G,I) and 48 hpf (F,H), anterior towards the left, dorsal towards the top. These are merged bright-field and fluorescent images, with the exception of F,G, which are fluorescent only. In order to visualise both soma and axonal projections, image F is a merge of two different focal planes. Both the schematics and the live images illustrate the similarity between the two results. For further information, see Table S2. (B,C,F,G) Co-injection live images; (D,E,H,I) Tol2 live images; (B,D) forebrain, indicated by arrows in B; (C,E) midbrain-hindbrain boundary, arrows; (F,H) spinal cord; (G,I) eye. Abbreviations; e, eye; hb, hindbrain; mb, midbrain; nc, notochord; sc, spinal cord; y, yolk. |