
- Title
-
Minor change, major difference: divergent functions of highly conserved cis-regulatory elements subsequent to whole genome duplication events
- Authors
- Goode, D.K., Callaway, H.A., Cerda, G.A., Lewis, K.E., and Elgar, G.
- Source
- Full text @ Development
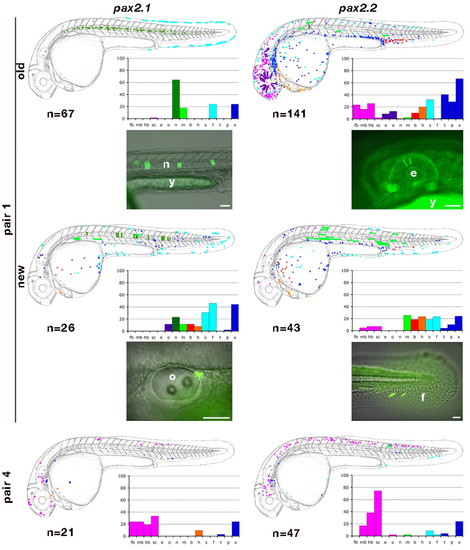
Schematic diagrams of expression profiles derived from assaying pax2 element pairs 1 and 4. Expression in each domain is colour coded according to the key in Fig. 2 and mapped onto camera lucida drawings of day 2 and day 3 zebrafish embryos (day 2 is shown here). Results are overlaid from multiple embryos. n indicates the number of embryos analyzed. The percentage of GFP-positive embryos with expression in each domain (y-axis) is indicated in the respective bar charts. For pair 1, ‘old’ indicates results from our original assay and ‘new’ indicates results from our newer assay without the flanking sequences. Live images of day 3 embryos are also shown for these assays, with expression in the notochord (pax2.1 old), eye (pax2.2 old), otic vesicle (pax2.1 new) and fin (pax2.2 new). Expression in the eye is shown as a fluorescent image, whereas the rest are shown as merged fluorescent and bright-field images. b, blood; e, eye; f, fin; fb, forebrain; h, heart; hb, hindbrain; m, muscle; mb, midbrain; n, notochord; o, otic vesicle; p, pronephric region; s, skin; sc, spinal cord; t, thyroid region; x, other, unclassified; y, yolk. Scale bars: 50 μm. |
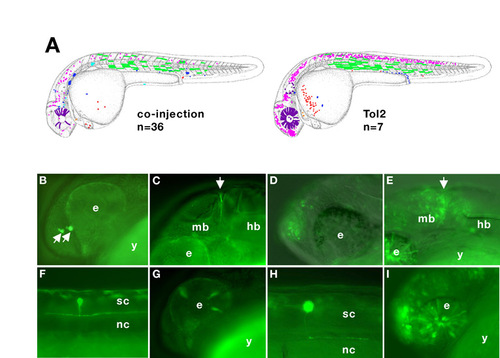
Comparison of our co-injection assay and a Tol2 cloning strategy. (A) Schematic diagrams of the expression profile of a pax2.1 CNE (CRCNE00000063-4) functionally analysed using the co-injection (left) and Tol2 cloning (right) methodology. n, the number of positive embryos used to generate these composite schematics (fewer embryos were used for the Tol2 image because many more cells were labelled per embryo). (B-I) Live images of embryos at 24 hpf (B-E,G,I) and 48 hpf (F,H), anterior towards the left, dorsal towards the top. These are merged bright-field and fluorescent images, with the exception of F,G, which are fluorescent only. In order to visualise both soma and axonal projections, image F is a merge of two different focal planes. Both the schematics and the live images illustrate the similarity between the two results. For further information, see Table S2. (B,C,F,G) Co-injection live images; (D,E,H,I) Tol2 live images; (B,D) forebrain, indicated by arrows in B; (C,E) midbrain-hindbrain boundary, arrows; (F,H) spinal cord; (G,I) eye. Abbreviations; e, eye; hb, hindbrain; mb, midbrain; nc, notochord; sc, spinal cord; y, yolk. |