
Fig. 5
- ID
- ZDB-FIG-110128-25
- Publication
- Koyama et al., 2011 - Mapping a sensory-motor network onto a structural and functional ground plan in the hindbrain
- Other Figures
- All Figure Page
- Back to All Figure Page
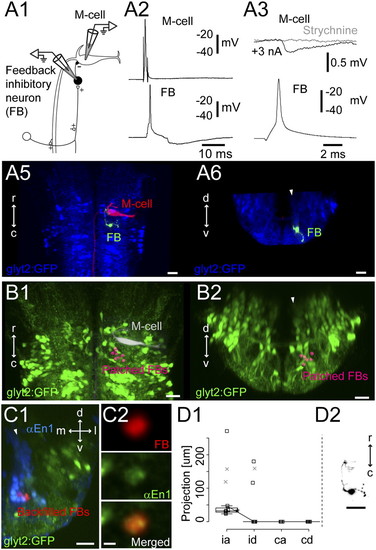
Feedback-inhibitory neurons. (A1) Pairwise recordings from a feedback-inhibitory neuron at rhombomere 5 and the ipsilateral M-cell in the Tg(glyt2:GFP) x relaxed line at 4 dpf. (A2) Firing the M-cell led to an action potential in the feedback neuron. (A3) Firing the feedback inhibitory neuron led to an IPSP in the M-cell that was blocked with 1 μM strychnine (gray line). (A5 and A6) Top-down (A5) and cross-section (A6, at rhombomere 5) views of the recorded feedback-inhibitory neuron (green) and the M-cell (red) relative to the glycinergic neurons (blue). Arrowhead marks the most medial glycinergic neurons. (B1 and B2) Summary of the position of nine recorded feedback-inhibitory neurons (pink) in top-down (B1) and cross-section (B2) views at rhombomere 5. Arrowhead marks the medial glycinergic stripe. (C1) Hemicross-section of backfilled feedback-inhibitory neurons (red) in the Tg(glyt2:GFP) at 5 dpf, immunostained forengrailed-1 (En1, blue). (C2) Single electroporated feedback neuron (FB) stained for engrailed (αEn1), and the merged image. (D1 and D2) Morphology of feedback-inhibitory neurons (n = 7 cells) formatted as in Fig. 2 C1 and C2. Black Xs mark two cells whose whole axonal extent was not captured. Asterisk marks the line for the neuron in D2. (Scale bars, 2 μm in C2, 20 μm in other panels.) |