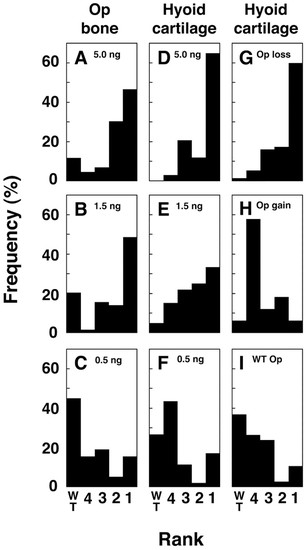
Opercle (A-C) and cartilage (D-F) phenotypes depend on the level of Edn1 reduction in edn1-MO-injected larvae, and co-vary in individual hyoid arches (G-I). The MO was injected at 5 ng, 1.5 ng and 0.5 ng. (A-F) Resulting sets of opercle and hyoid cartilage phenotypes, scored independently on both sides of individual larvae, and ranked according to severity. Facial phenotypes (not shown) are as expected (Miller and Kimmel, 2001). The highest levels of edn1-MO generally produce the more severe phenotype, resembling edn1 mutants. Milder facial phenotypes, resembling hoo- were observed at the lowest levels. The data are shown as percentages; the number of arches scored (left and right, considered separately) ranged from 33 to 75 for each panel, from a total of 73 larvae (146 sides). (A-C) Opercle ranks are: 1, missing; 2, reduced; 3, mildly expanded (Fig. 8B-F); 4, markedly expanded (Fig. 8G-K); wild type (WT), normal. (D-I) Hyoid cartilage phenotypes were scored according to degree of reduction (we do not observe completely missing cartilages or cartilage expansions), reflecting the spectrum previously shown [Fig. 9 of Kimmel et al. (Kimmel et al., 1998)]: 1 and 2: relatively severe reductions as in typical severe (1) and mild (2) edn1 mutants; 3, intermediate loss, as in typical she mutants; 4, mild loss, as in a typical stu mutants; WT, wild type. (G-I) The cartilage ranks shown in animals grouped (independently of the amount of injected MO) by their opercle phenotypes in the same (left or right) hyoid arches. Opercle ranks 1 and 2 (in A) together constitute the opercle-loss group; ranks 3 and 4 together constitute the opercle-gain group, and ranks 3 and 4 together constitute the opercle-gain group. We used Chi-square analysis (data not shown) to test and reject (P<0.001) the null hypothesis that severities of cartilage and bone phenotypes vary independently from one another in individual arches. MO, morpholino.
|
