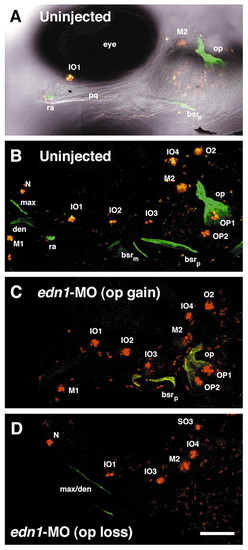
Correlated expressivities of opercle and lateral line neuromast phenotypes in edn1-MO-injected larvae (C,D), compared with an uninjected larva (A,B). Left-side views of live larvae, with dorsal to the top and anterior to the left at 6-days post fertilization. (B-D) Confocal z-series projections. (A) A single optical section from the image stack in B combining DIC with fluorescence for orientation. The bones are labeled with Calcein (green), and the neuromasts with DASPEI (orange-red). Neuromasts were identified (Raible and Kruse, 2000) and are labeled with upper case letters; other structures are labeled in lower case. (B) The normal neuromast distribution in the uninjected control. (C) An edn1-MO-injected larva expressing the opercle-gain phenotype, the branchiostegal ray (bsr) is also malformed. The complete set of neuromasts is present, however IO3 is displaced ventrally and M1 is displaced posteriorly. (D) An edn1-MO-injected larva expressing the opercle-loss phenotype. Both the opercle and branchiostegal ray are missing, and the mandibular dermal bones (max/den) resemble the condition in Fig. 3E. The neuromast phenotype in this particular larva is severe; losses include M1, IO2, O2 and the two opercular neuromasts OP1 and OP2. Scale bar: 100 μm. MO, morpholino.
|
